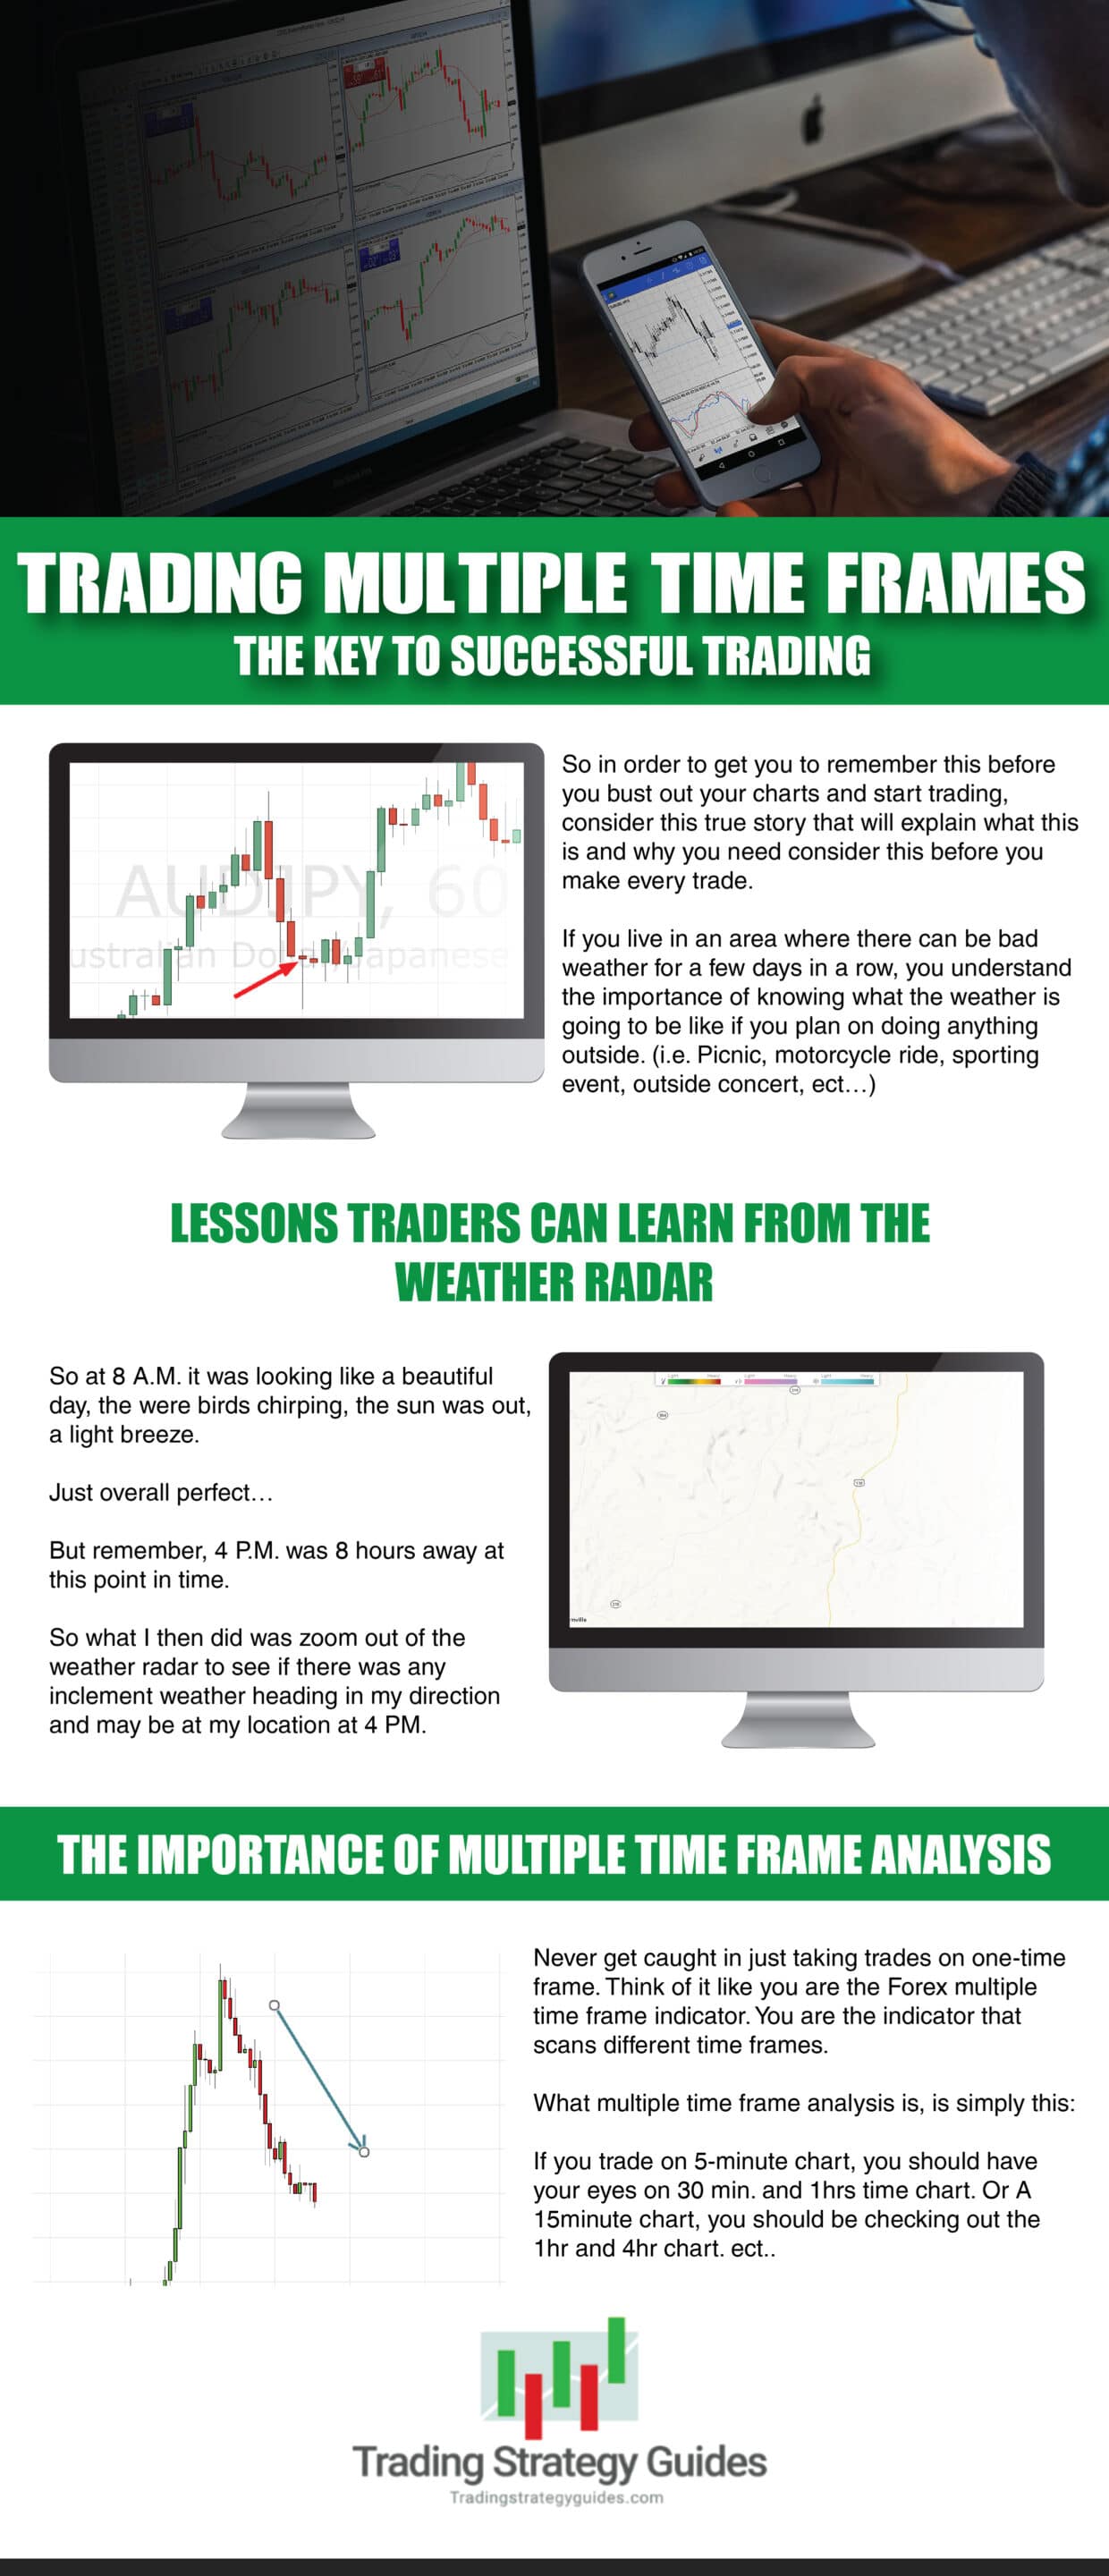
Trading Multiple Time Frames - The Key to Successful Trading

Multiple time frame analysis is one of the most important things you should be doing before you take every trade.
So, in order to get you to remember this before you bust out your charts and start trading, consider this true story. It explains what multiple frame trading is and why you should use it on every trade you take.
If you live in an area where there can be bad weather for a few days in a row, you understand the importance of knowing what the weather is going to be like if you plan on doing anything outside. (i.e. Picnic, motorcycle ride, sporting event, outside concert, etc.)
Especially if you live in areas where there are always a potential for tornadoes, hail storms, snowstorms, hurricanes, and so on.
So let me explain a few very important lessons (as traders) we can learn by simply scanning the weather radar. Also, read the Simple way of trading multiple time frames in forex.
Lessons Traders can Learn from the Weather Radar
This may sound silly but trust me, this is some good stuff...
The other day I was planning an outside activity that required there to be no rain, no snow, no excessive winds, etc.
You get the point...
It needed to be nice and sunny out at this time (4 PM).
Well...
Here is what the radar would have looked like earlier in the day before the special event I was planning at 8 a.m.

So at 8 a.m., it was looking like a beautiful day. The birds were chirping, the sun was out, a light breeze.
Just overall perfect.
But remember, 4 p.m. was 8 hours away at this point.
So what I then did was zoom out of the weather radar to see if there was any inclement weather heading in my direction and will be at my location at 4 p.m.
Well as you may expect, here is what I found:

Snow/rain storms were heading in quickly. This horrible weather will be at my exact location roughly around the time of my planned activity!
Long story short, I ended up rescheduling my event due to the inclement weather that was going to take place.
To tie this example into our trading habits, if I would have not “zoomed out” at a larger frame and saw what was taking place a few hundred miles away, I would have been devastated when the time came for my event and there were 6 inches of snow on the ground.
This exact scenario can be compared to multi-time frame analysis. We do as traders on our charts every time we trade.
The Importance of Multiple Time Frame Analysis
Never get caught in just taking trades on one timeframe. Think of it like you are the Forex multiple time frame indicator. You are the indicator that scans different time frames.
What multiple time frame analysis is, is simply this:
If you trade on a 5-minute chart, you should have your eyes on 30 min and 1hr time charts. If you trade on a 15-minute chart, you should be checking out the 1hr and 4hr chart, etc.
Here's an example:

You see a move like above on a 5-minute chart and you think "wow I need to get in the short trade."
But what you have not done is “zoom-out” and check other larger time frames that may be showing something different.

As you see above on a larger 1-hour time chart, this may have been a simple retracement before heading back in a bullish trend.
That is why it is important to check other time frames every time you want to make a trade.
Most of the time, you will learn a great amount of information if you bump up to a larger time frame or bump down to a shorter one you are currently on. Look for prior support, resistance, a trending pair, or one that is in a current channel.
Here are some of the main advantages of using this type of approach before you enter a trade:
Benefits of Multiple Time Frame Analysis
- Key levels of support and resistance may exist near your trade, but that can’t be seen on the time-frame you are trading on.
- The trend may appear differently on the time-frame you are looking at than where the long term trend is moving.
- Price may appear to have room to move on one time-frame where it is actually quite over-extended on a lesser time-frame.
- You can make a much more precise entry point on shorter times than on longer ones.
- You may take a great trade on a short time-frame and hit your target, but not realize you could have let it run for a way bigger profit due to the longer-term trend.
We hope this information helps you see the importance of doing this multiple time frame analysis before you ever consider taking a trade. Don't forget to read about the multi time frame moving average strategy.
So maybe next time you check out your weather radar on your phone/computer you will think about this example. Remember the importance of multiple time frame analysis. 🙂
Thanks for reading!
Please leave a comment below if you have any questions about Trading Multiple Time Frames!
Also, please give this strategy a 5 star if you enjoyed it!
Check out our Fibonacci trend line strategy that uses this approach to trading in the strategy.
 (21 votes, average: 5.00 out of 5)
If you like this grab our multiple time frame analysis pdf strategy here!
Please Share this Trading Strategy Below and keep it for your own personal use! Thanks Traders!
With over 50+ years of combined trading experience, Trading Strategy Guides offers trading guides and resources to educate traders in all walks of life and motivations. We specialize in teaching traders of all skill levels how to trade stocks, options, forex, cryptocurrencies, commodities, and more. We provide content for over 100,000+ active followers and over 2,500+ members. Our mission is to address the lack of good information for market traders and to simplify trading education by giving readers a detailed plan with step-by-step rules to follow.


 (
(


