A Complete Guide to Stochastic Indicator
Let me ask you…
Have you ever looked at a chart and noticed the Stochastic indicator is overbought.
So, you immediately go short because you think the market is about to reverse.
And here’s what happened next…
The market stalls.
Pause for a while.
…and then it blasts off higher!
Clearly, you got stopped out of your trade and you wonder to yourself…
“Wtf just happened?”
Well, you’re not alone.
That’s why I wrote this Stochastic indicator trading guide to teach you everything you must know about Stochastic, how to use it, how NOT to use it, and why.
Here’s what you’ll learn:
- Stochastic indicator explained: What is it and how does it REALLY work
- The 2 DEADLY mistakes traders make when using Stochastic and how to avoid it
- How to use the Stochastic indicator and “predict” market turning points
- How to use the Stochastic indicator and filter for high probability trading setups
- How to better time your entries with the Stochastic indicator
- When NOT to use Stochastic indicator (hint: it goes against what the “gurus” are telling you)
You can watch this training video below:
Stochastic indicator explained: What is it and how does it REALLY work
Now:
Instead of me explaining what the Stochastic indicator is about, here’s what the founder of Stochastic has to say…
“Stochastics measures the momentum of price.
If you visualize a rocket going up in the air – before it can turn down, it must slow down.
Momentum always changes direction before price.” – George Lane
In other words:
The Stochastic is an indicator that measures momentum in the markets.
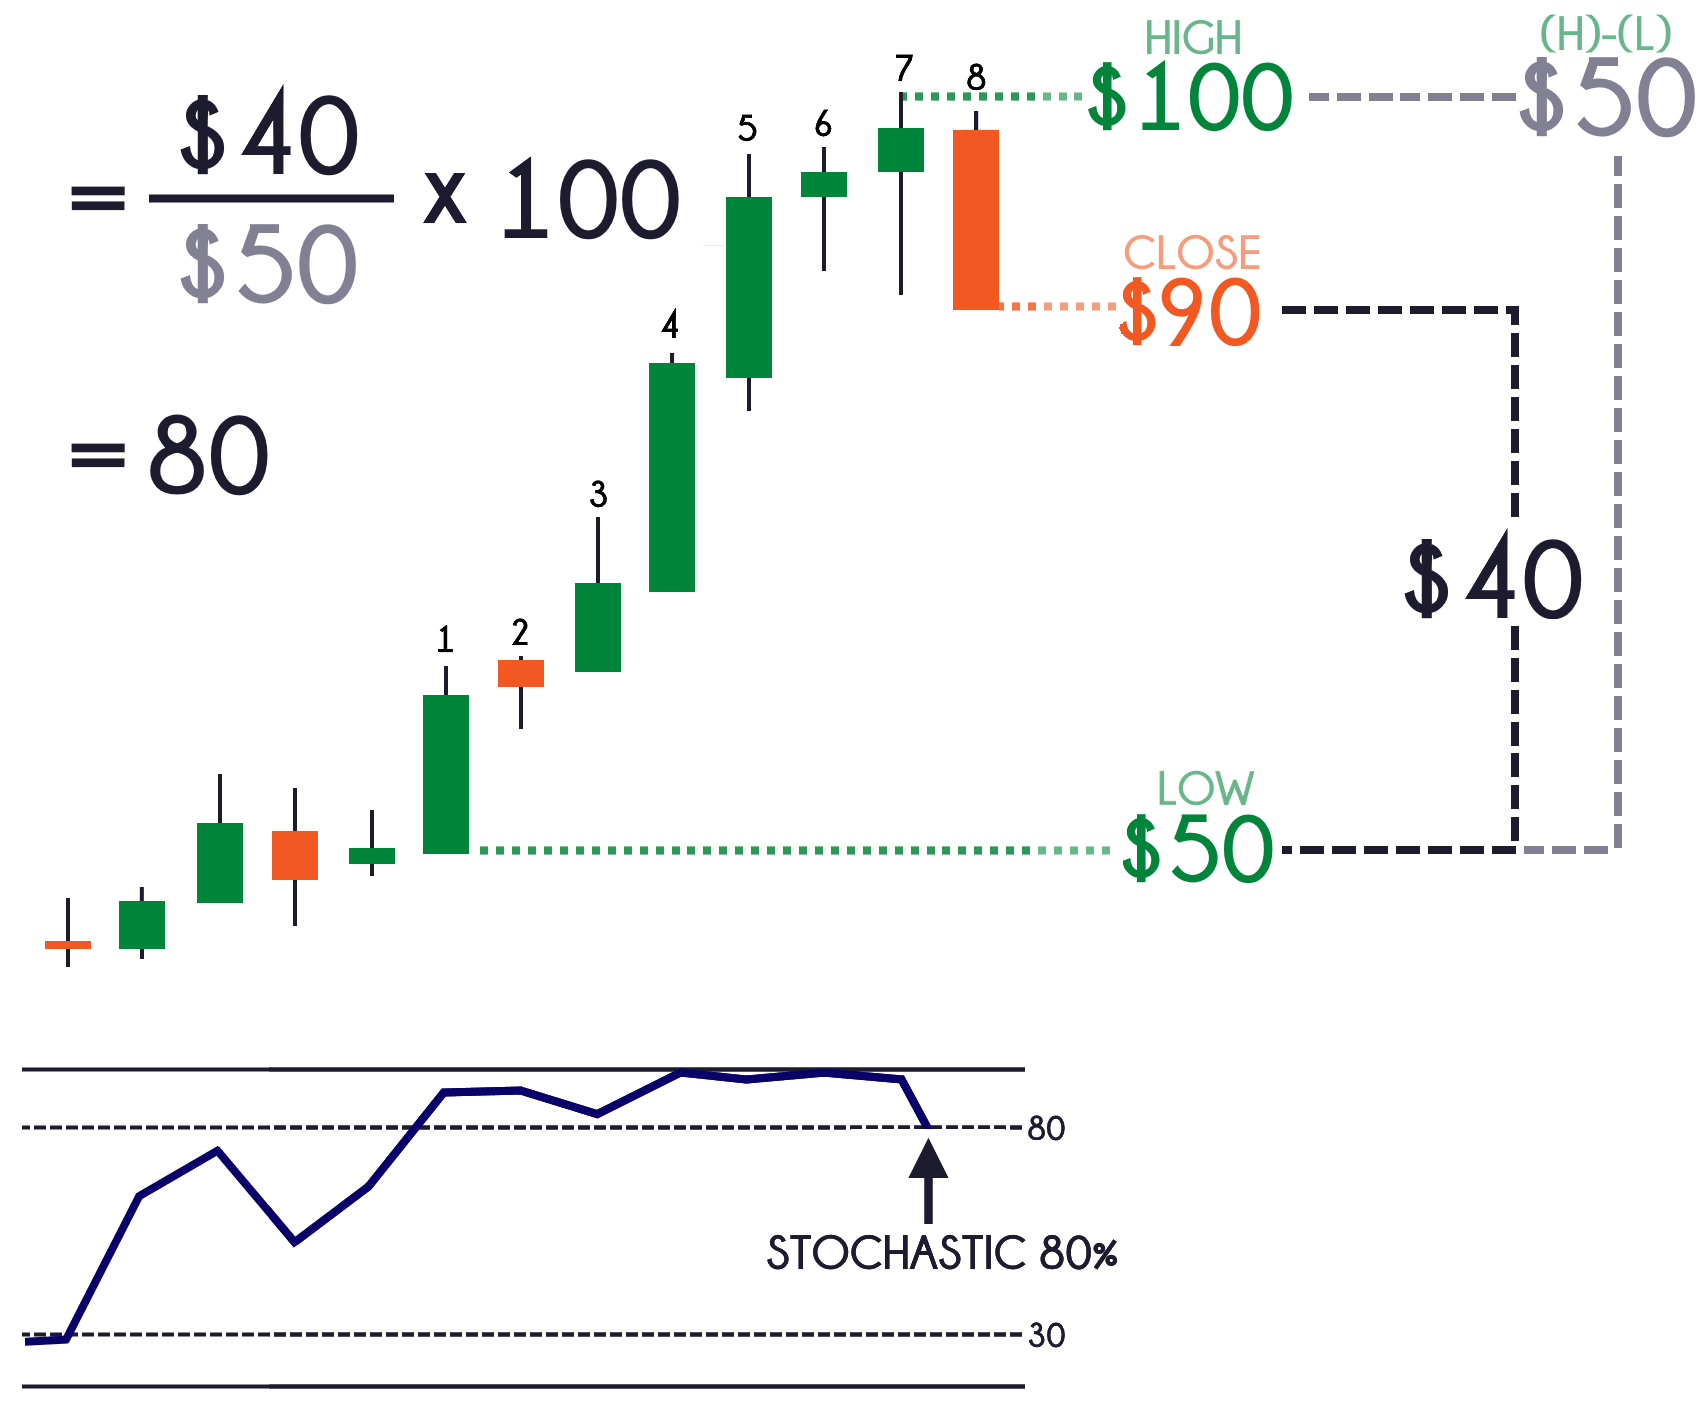
%D = 3-day SMA of %K
Where:
Lowest Low = lowest low for the look-back period
Highest High = highest high for the look-back period
%K is multiplied by 100 to move the decimal point two places
Are you confused?
Yeah, me too!
That’s why this image below will explain better (using an 8 period Stochastic)…
Stochastic indicator settings
Now just a quick one.
The settings on my Stochastic indicator is (20, 1, 1) and it’ll show a single line instead of the traditional 2 lines.
Here’s what I mean:
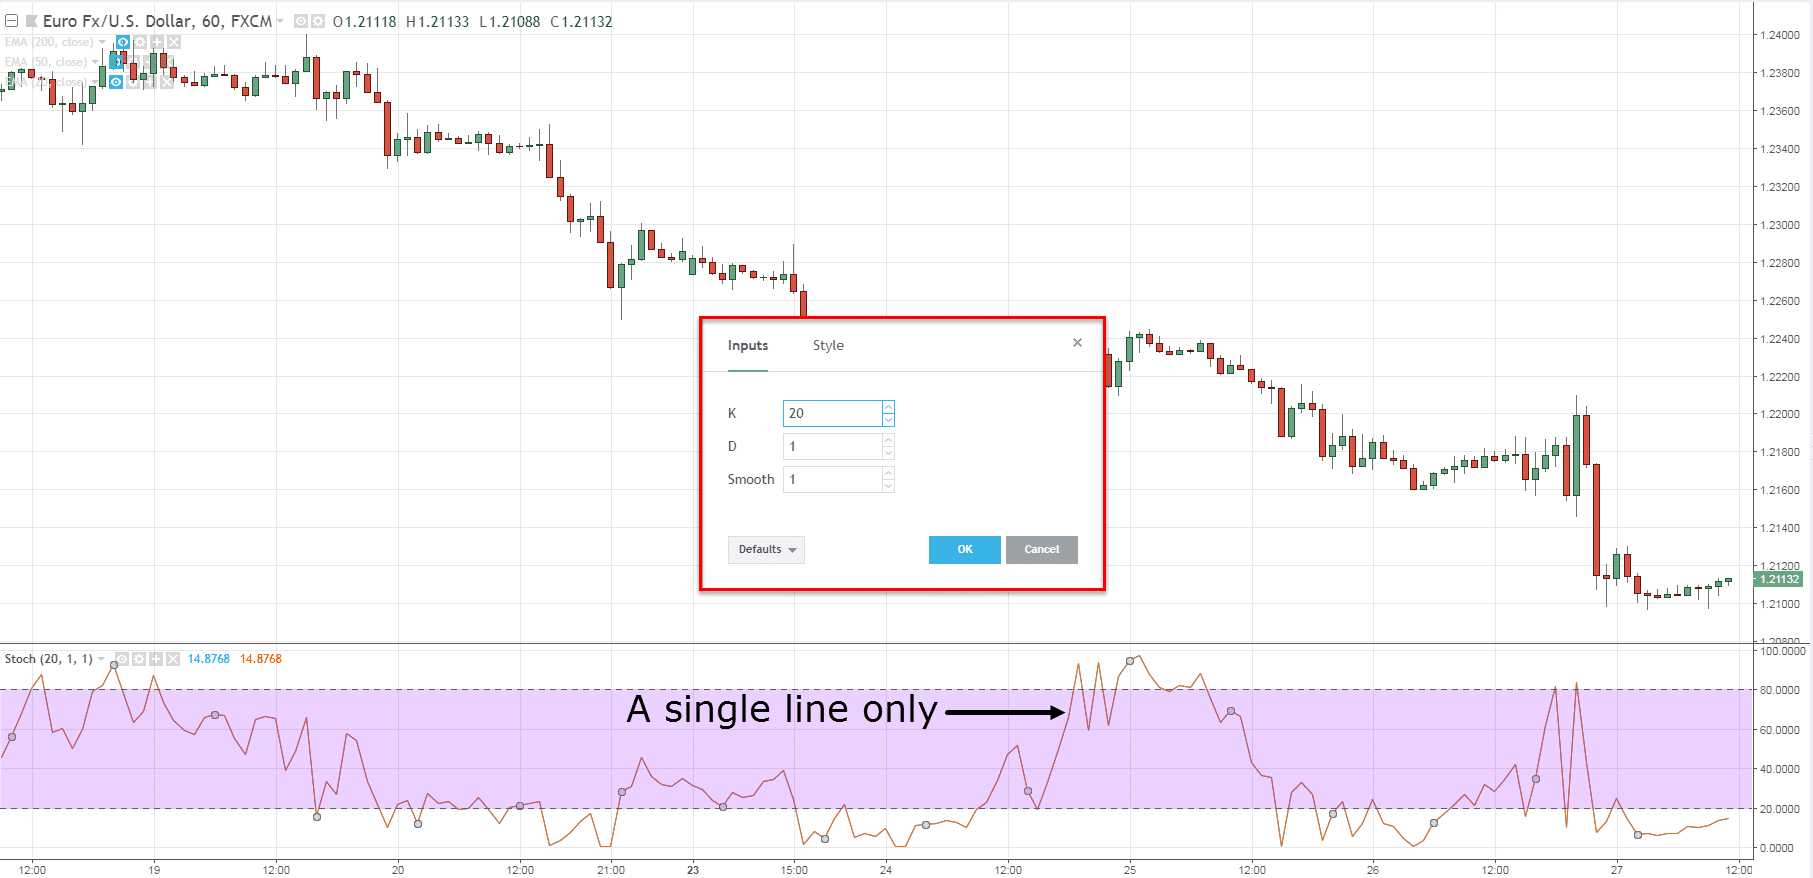
I use 20-period because there are 20 trading days in a month, and a single line is enough to interpret what it means.
Does it make sense?
Great! Then let’s move on…
2 DEADLY mistakes traders make when using the Stochastic indicator — and how you can avoid it
This is important.
If you can avoid these mistakes, then you’ll save yourself hundreds if not thousands of dollars in the long run.
They are:
- Going long just because the market is oversold
- Thinking the market will reverse because you spot a divergence
I’ll explain…
1. You go long just because the market is oversold
Recall:
The Stochastic is an indicator that measures momentum in the markets.
So, when it’s at overbought level (above 80), it means the market has strong bullish momentum.
And the last thing you’d want to do is “blindly” go short just because Stochastic is overbought.
Here’s why:
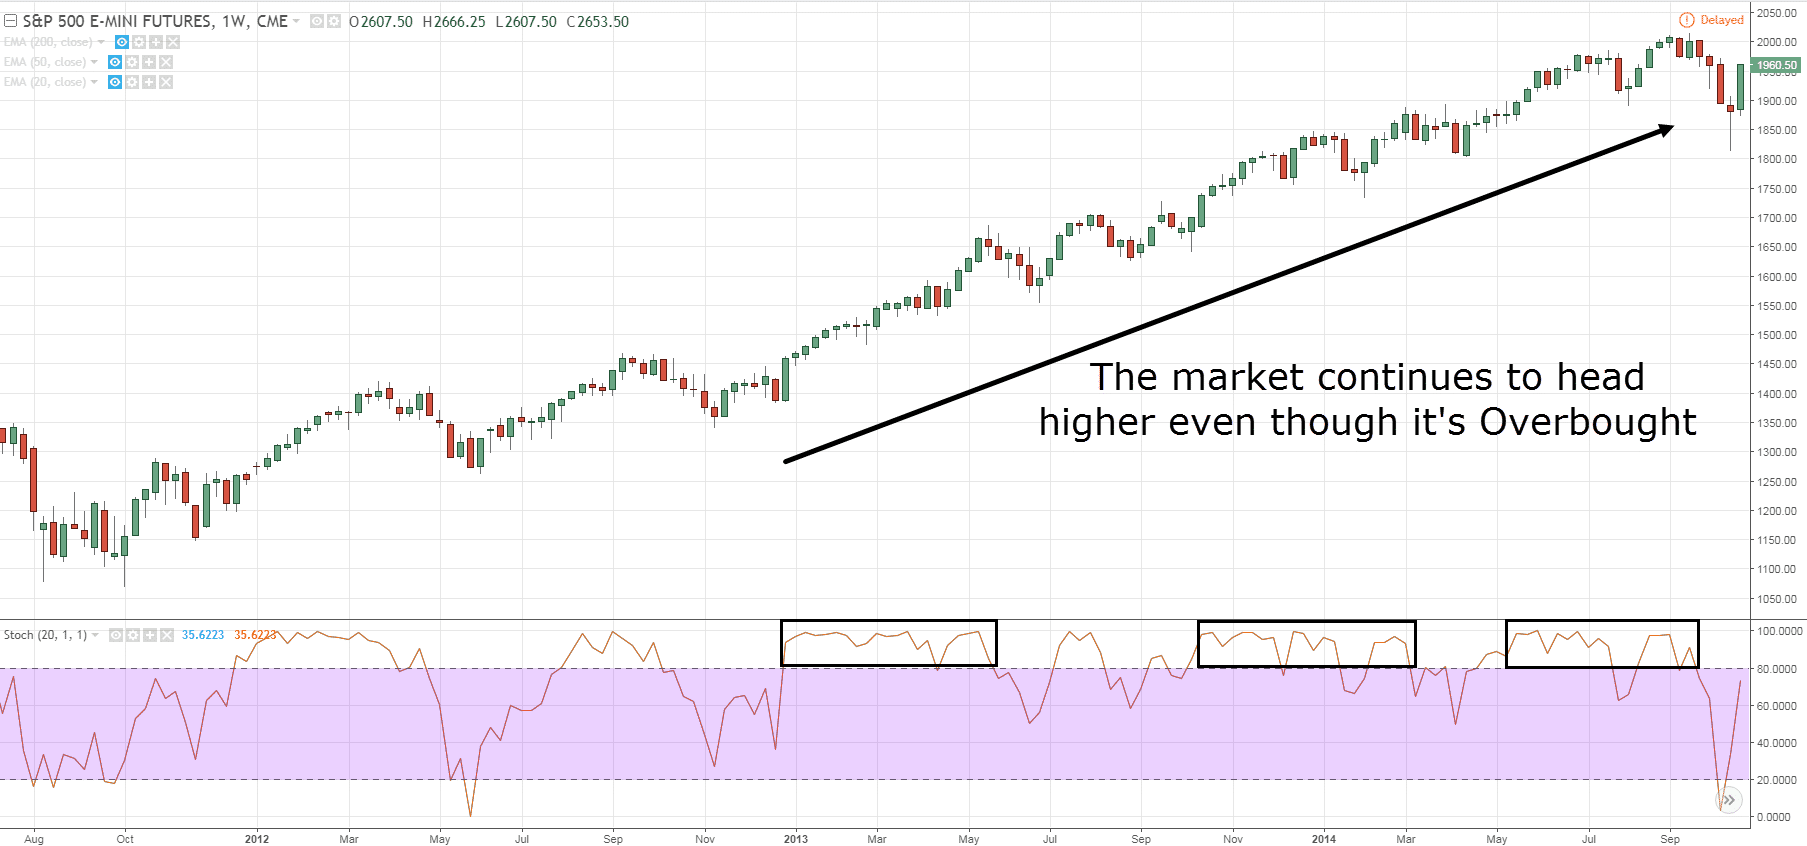
As you can see, if you went short just because the market is overbought, it would have been a painful experience.
Because the market can remain overbought/oversold for a long period of time – far longer than your account can withstand it.
Next, let’s move on to the 2nd deadly mistake made by traders…
2. You think the markets will reverse because there’s a divergence
A divergence occurs when the price makes a higher high but the indicator shows a lower high — which means the 2 signals diverge from one another.
Now…
According to trading textbooks, courses, and etc. they will tell you that when you spot a divergence, it means a reversal is about to occur.
But that couldn’t be further from the truth.
Here’s an example:
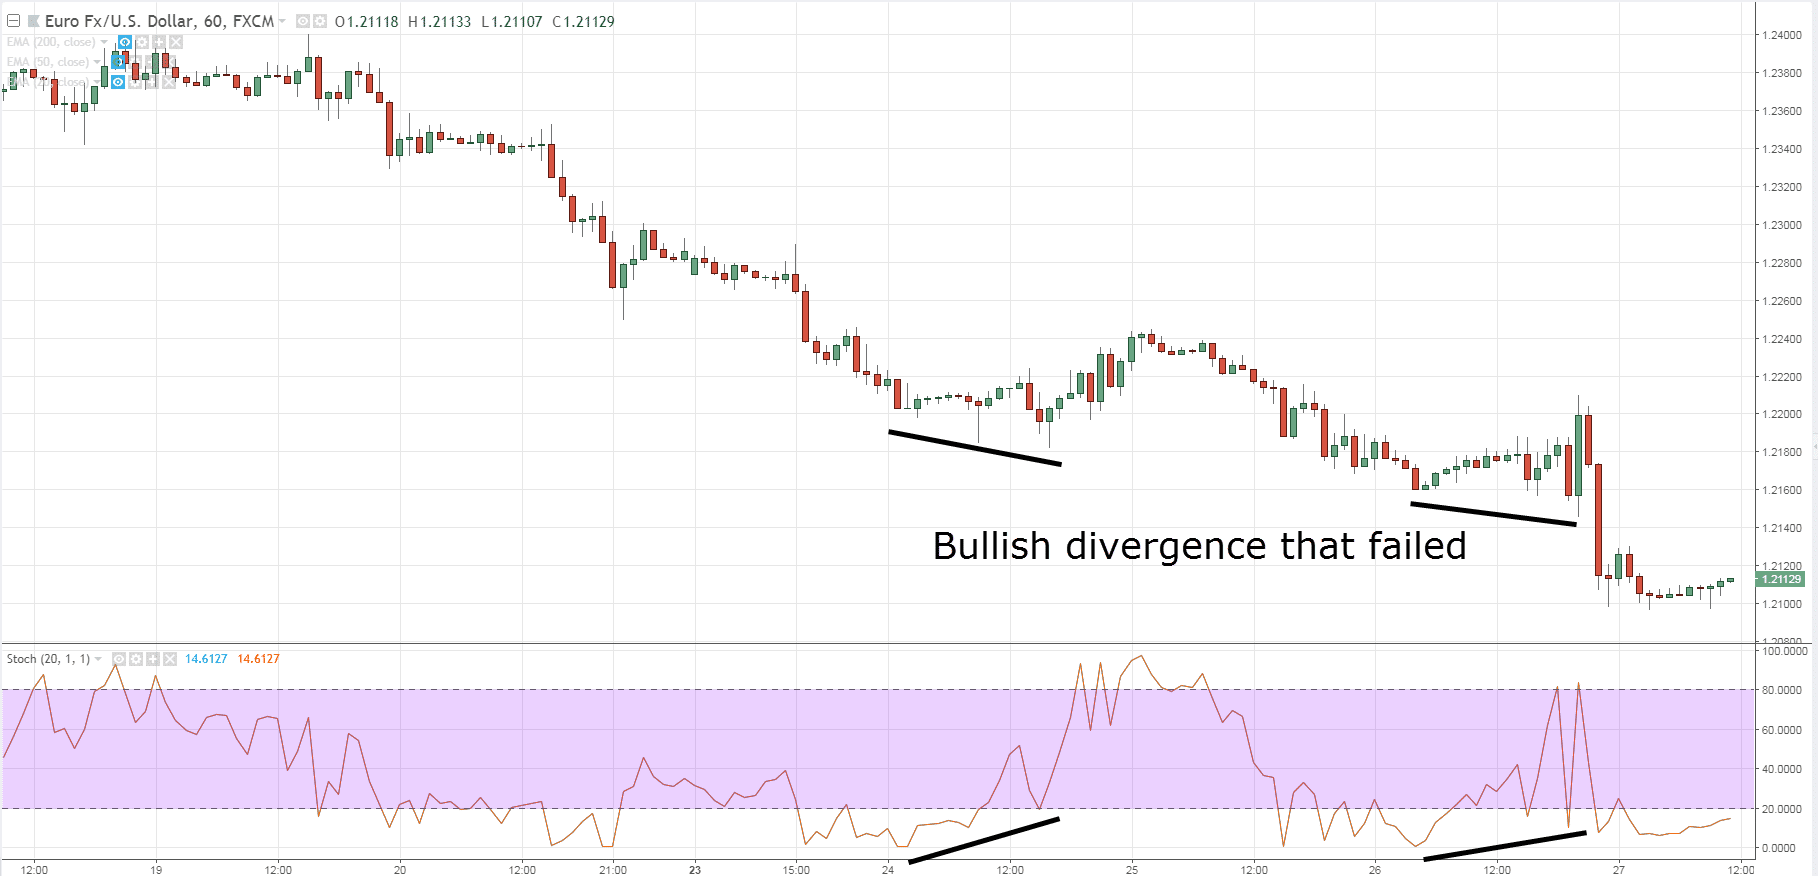
As you can see, there’s a divergence but the market didn’t reverse.
In fact, it continued to head lower for quite a while.
Now at this point…
You’ve learned the 2 biggest mistakes traders make when using Stochastic and how to avoid it.
Now you’re probably wondering:
“So, what is the correct way to use the Stochastic indicator?”
Well, that’s what I will share in the next section.
Read on…
How to use the Stochastic indicator and “predict” market turning points
If you haven’t realized by now…
The reason why traders fail with Stochastic is because…
You don’t use it in the context of the market.
You’re probably thinking:
“What does it mean?”
Simple.
Trade with the trend — and not against it.
If you look at the earlier examples, most of the common mistakes can be avoided if you’re not trading against the trend.
Make sense?
Great!
Then let’s see how you can adopt this principle and use Stochastic to “predict” market turning points.
Here’s how…
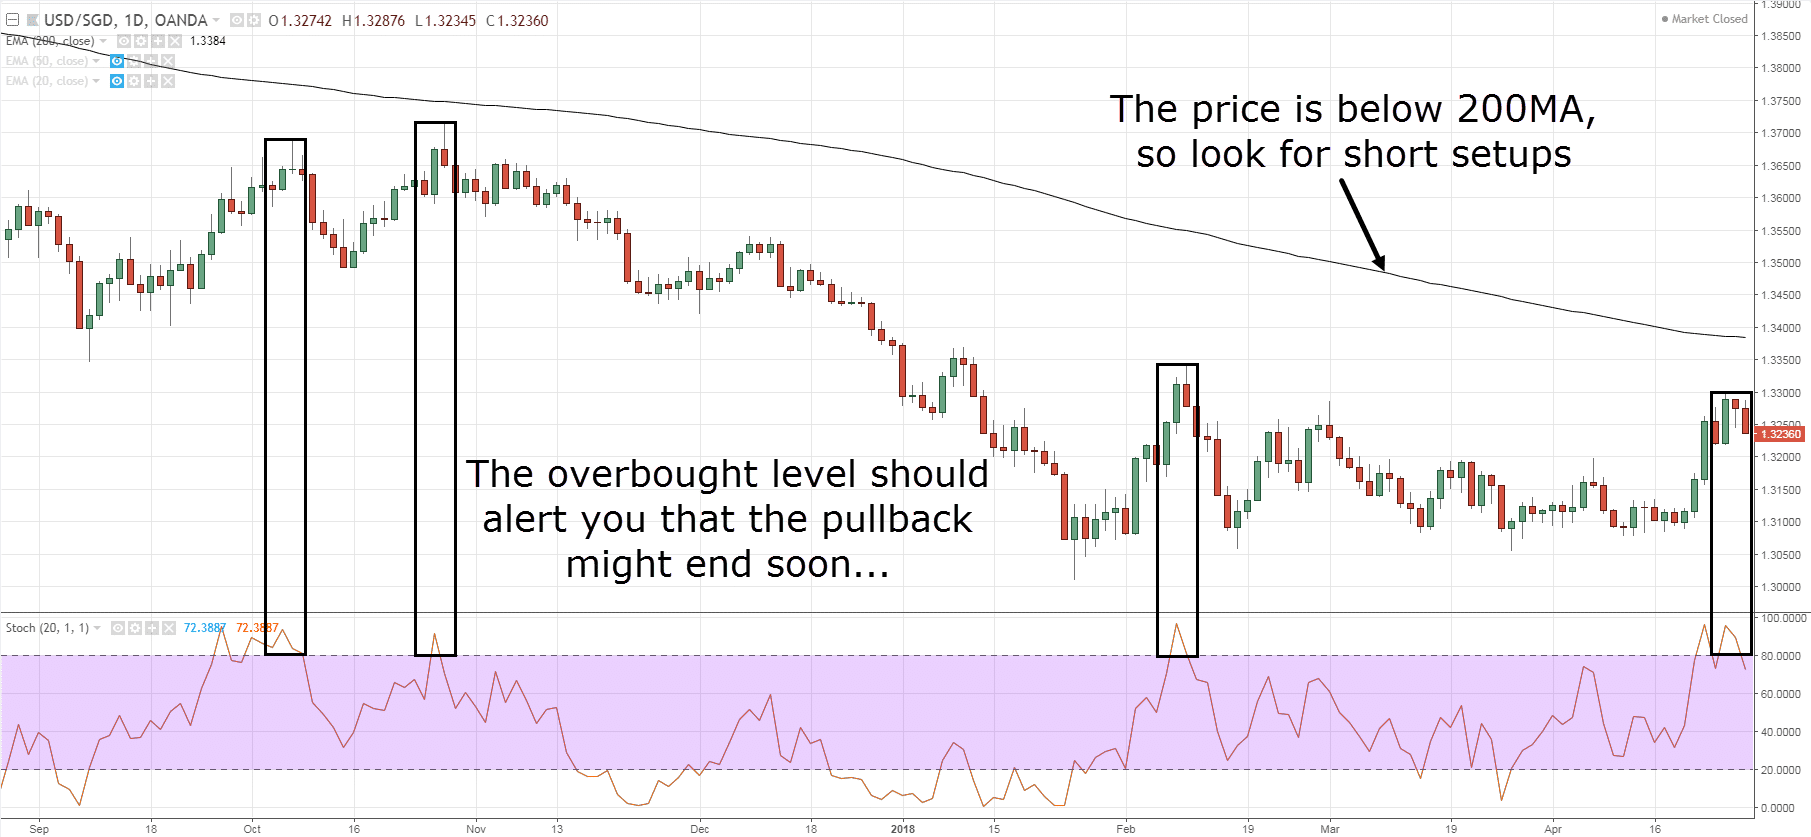
- If the price is above 200-period moving average (MA), then look for long setups when Stochastic is oversold
- If the price is below 200-period moving average (MA), then look for short setups when Stochastic is overbought
Here’s an example:
Now…
This doesn’t mean you “blindly” go short when Stochastic is overbought.
But it can help you anticipate where the pullback might end, so you can better time your entry and trade with the trend.
Can you see how a simple tweak makes a BIG difference?
Great!
Moving on…
How to use the Stochastic indicator and filter for high probability trading setups
I’m not sure about you.
But whenever I put on a trade, I want to know where I am in the “big picture”.
Why?
Because if you want to find high probability trades, then you want to be trading with the higher timeframe trend — and not against it.
So how do you do it?
Well, you can use the Stochastic indicator to filter your trades.
Here’s how…
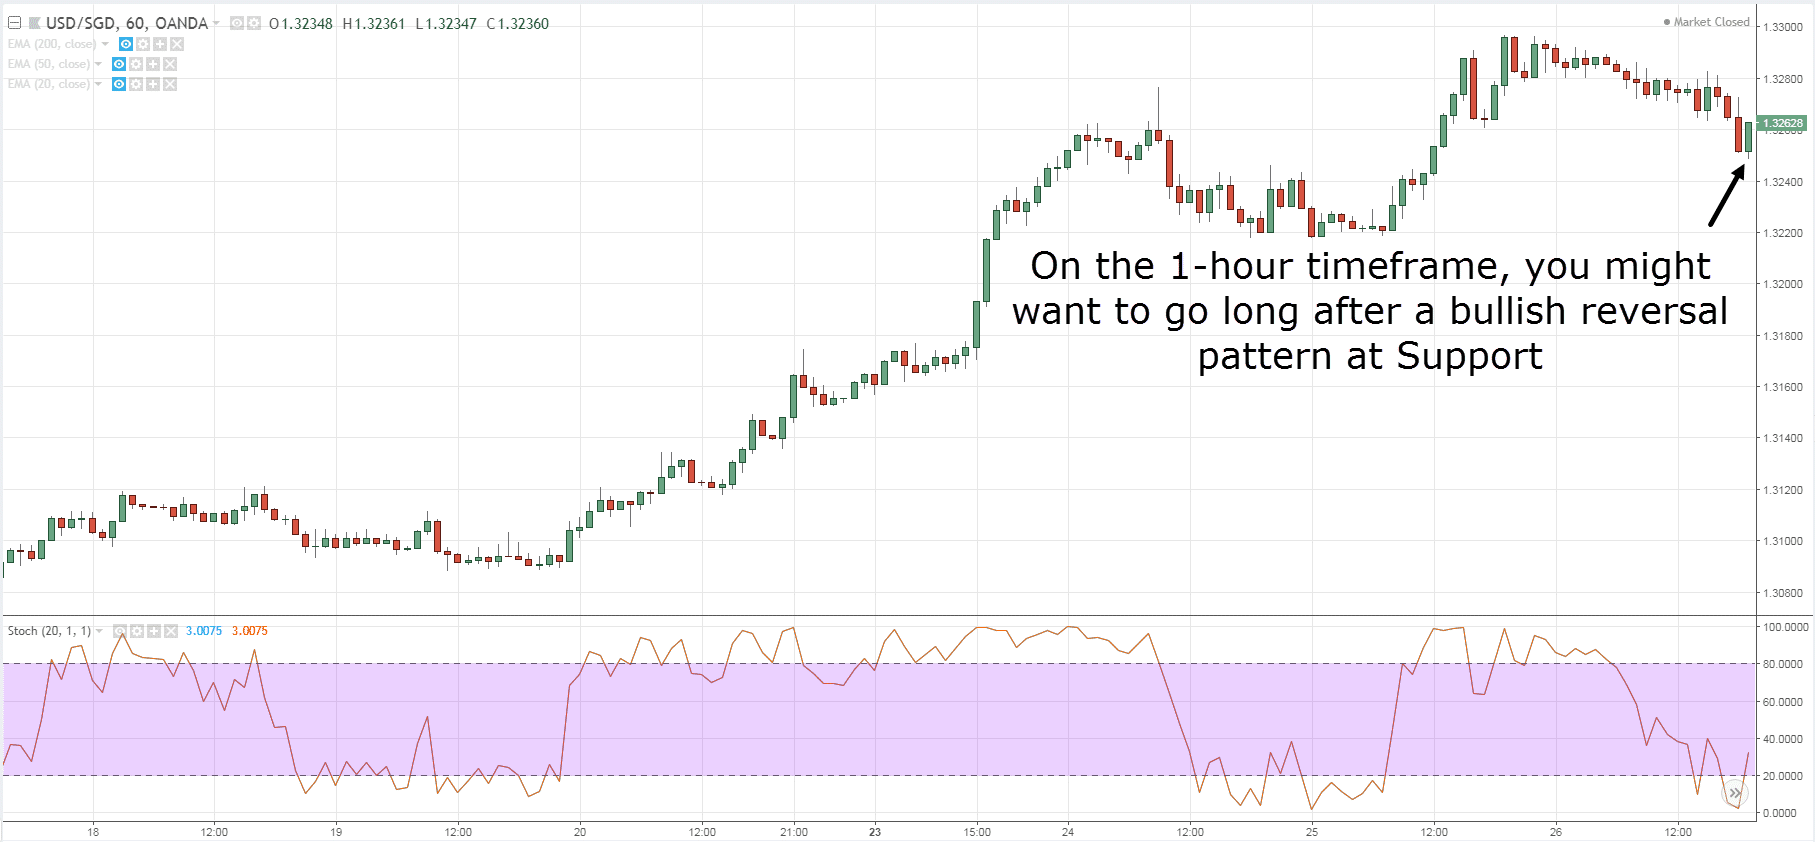
Let’s say you want to go long on the 1-hour timeframe.
But before you do so, check the daily timeframe and see where you are in the “big picture”.
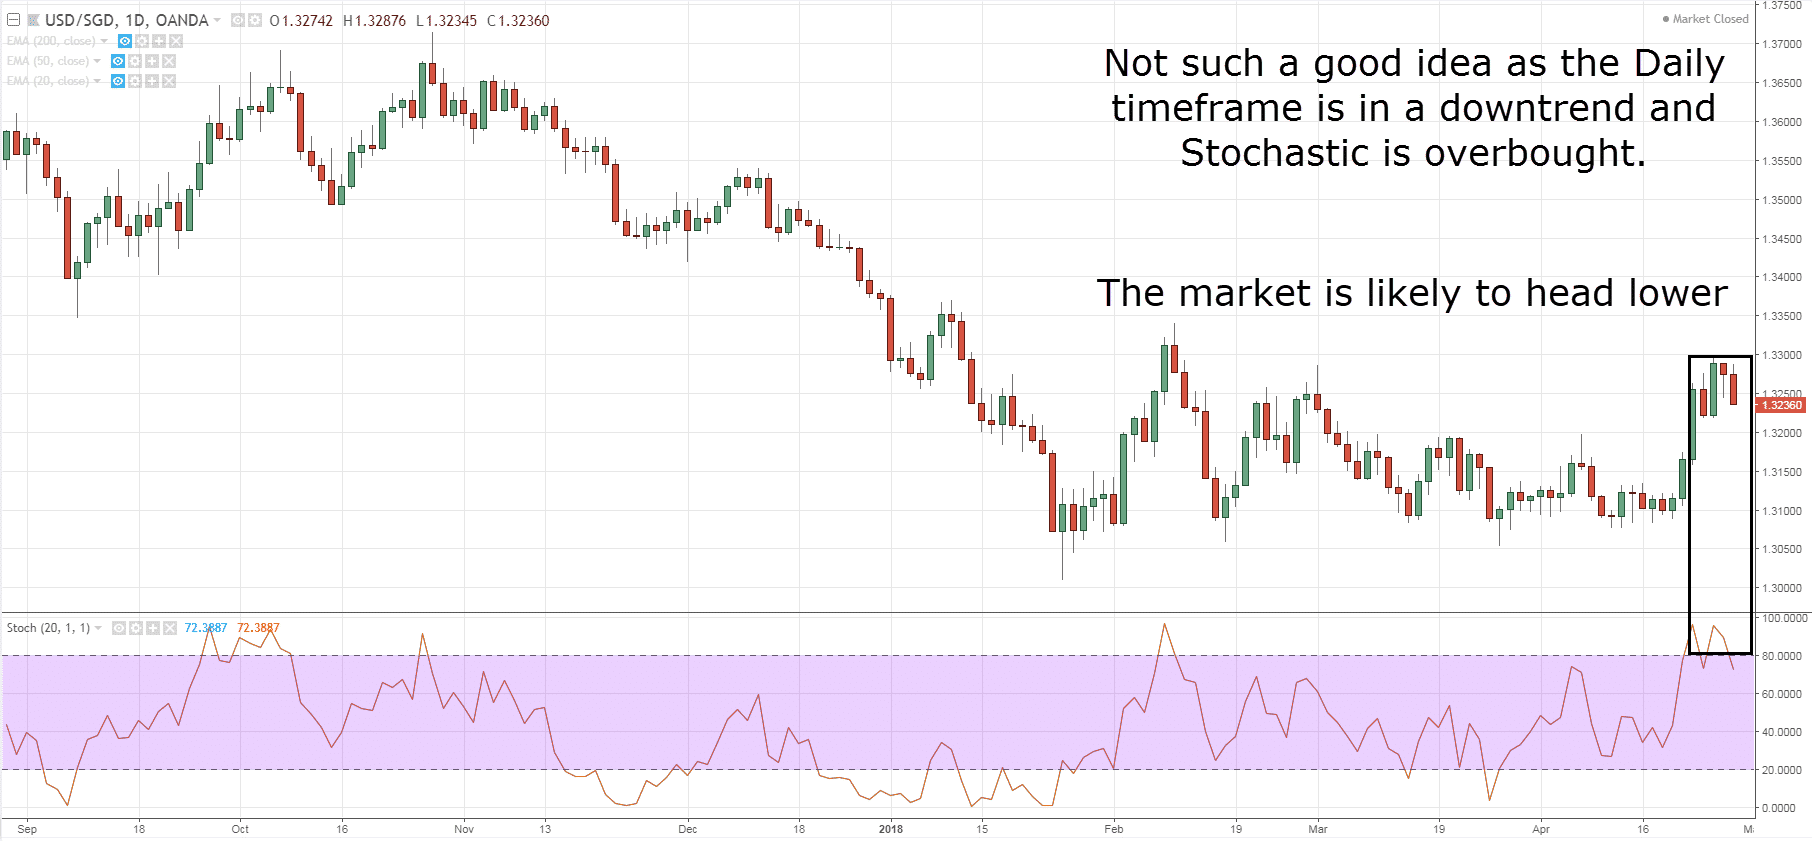
You want to make sure the daily timeframe is not in a downtrend with Stochastic overbought.
Because that’s where the market is likely to head lower — and you don’t want to be long.
An example:
Most of you might want to go long based on the chart below…
But…
If you look at the higher timeframe, you’ll realize something is not right.
The higher timeframe is in a downtrend and Stochastic is at overbought level.
So chances are, the market is likely to continue trading lower, and you don’t want to be long.
Here’s what you should do instead:
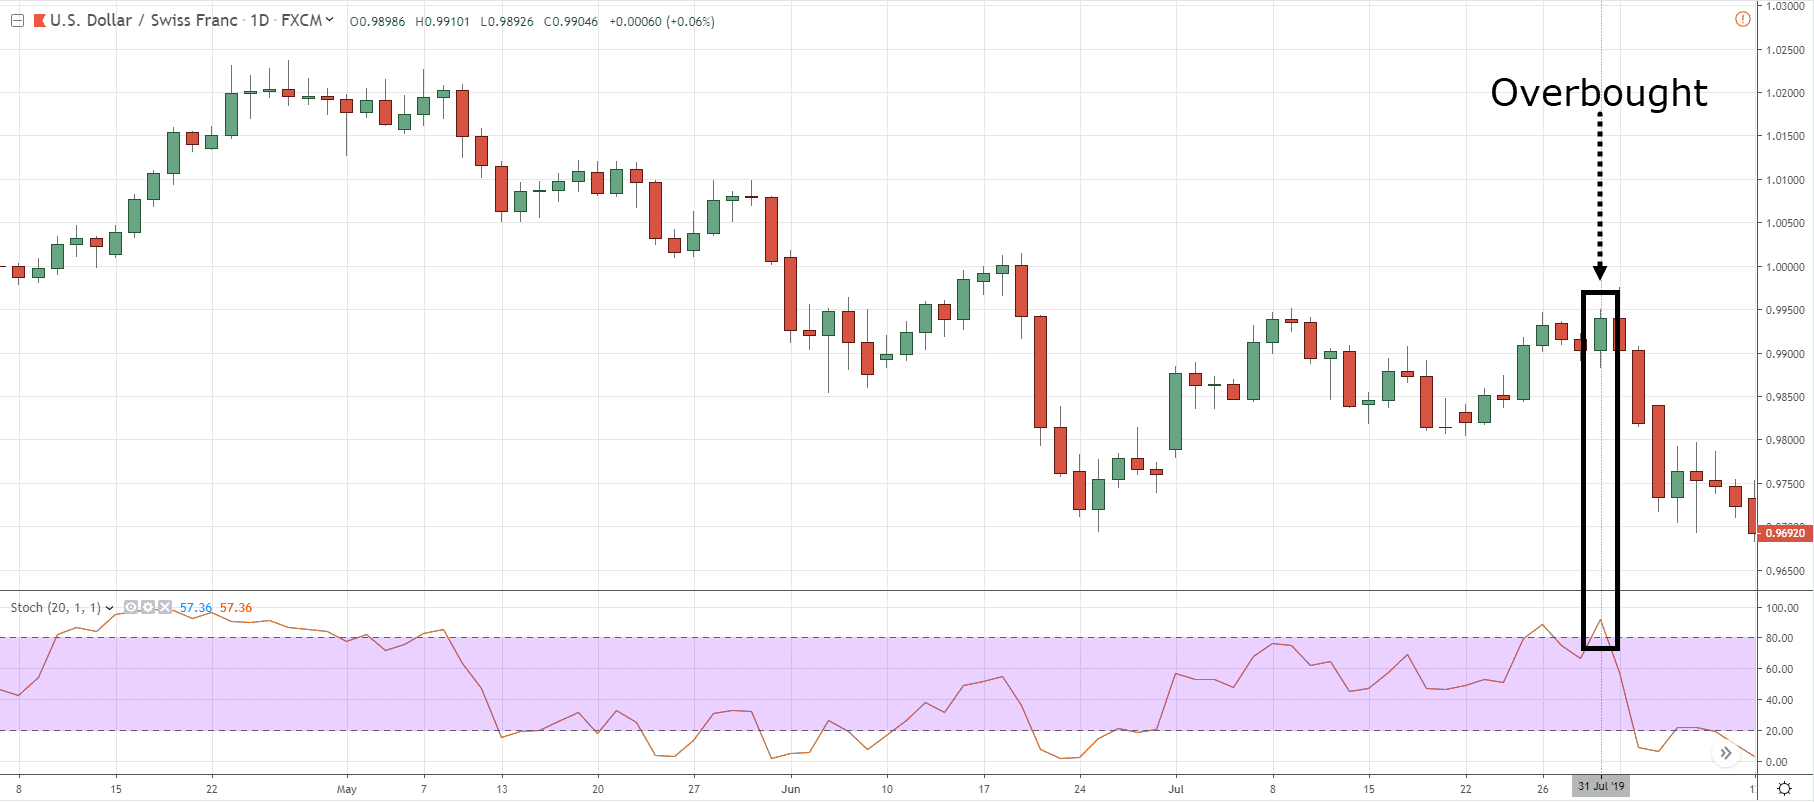
If the Daily timeframe is in a downtrend with stochastic overbought…
You’ll look for trading setup on the lower timeframe – to go short.
Your entry trigger can be a bearish breakdown from Support on the 1-Hour timeframe.
I’ll explain…
USD/CHF on Daily timeframe with Stochastic overbought:
USD/CHF on 1-Hour timeframe breaking down from support:
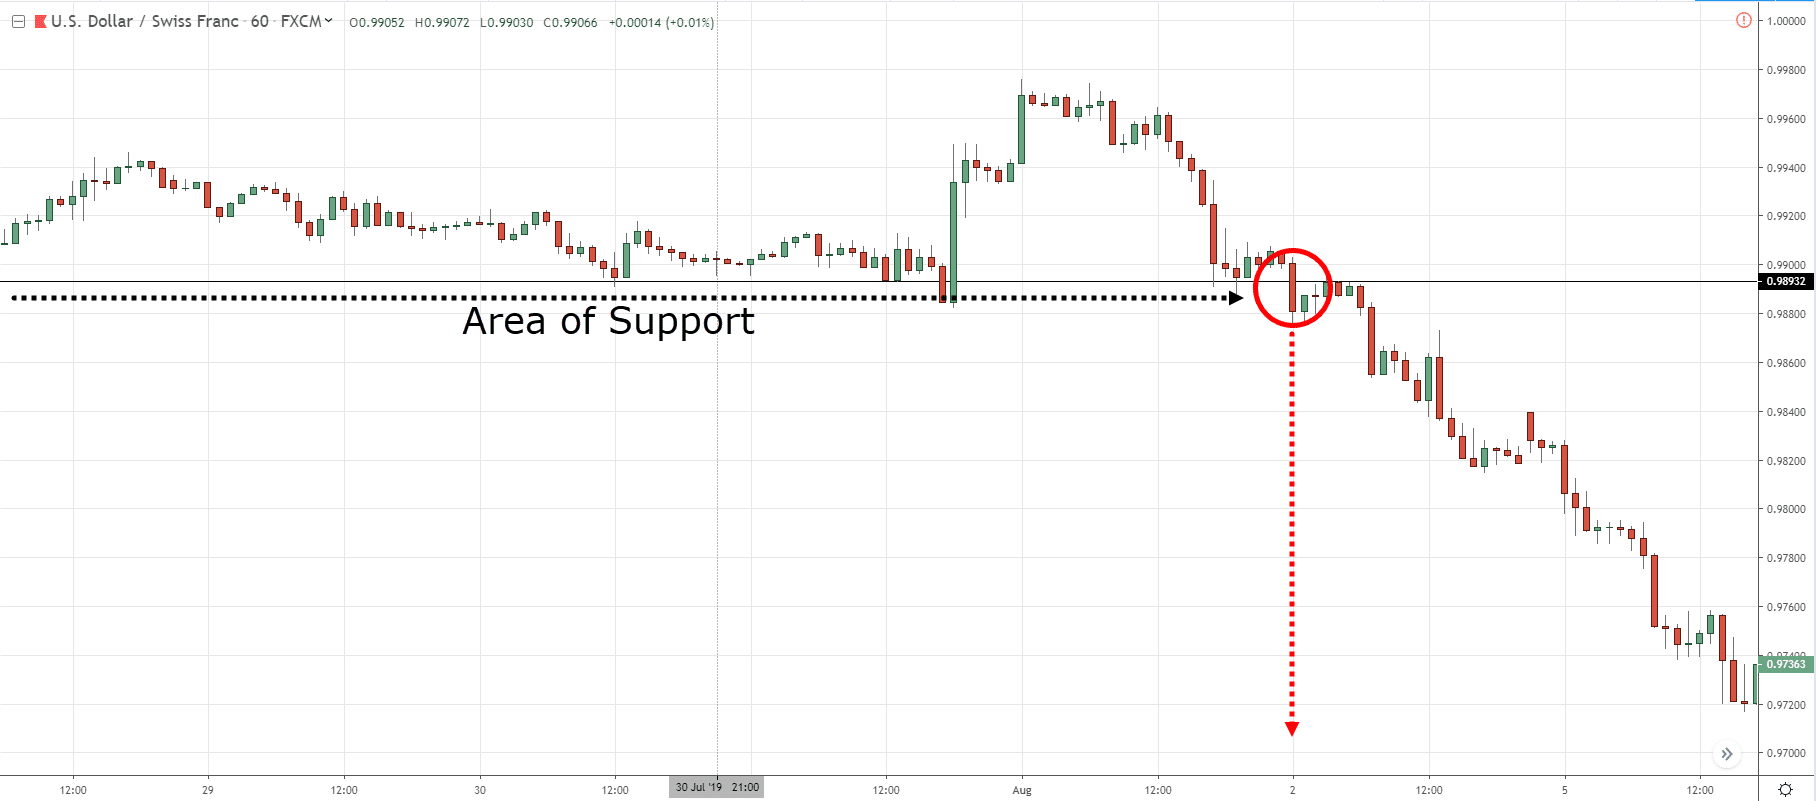
Can you see how it works?
Great!
How to use the Stochastic indicator to better time your entries
Now unlike chart or candlestick patterns where the entry can be subjective, the Stochastic indicator doesn’t give you that problem.
That’s because there’s no discretion for the entry.
It’s either YES you enter, or NO you stay out.
So if you’re the type of trader that is always unsure whether you should pull the trigger, then this entry technique is for you…
Here’s how…
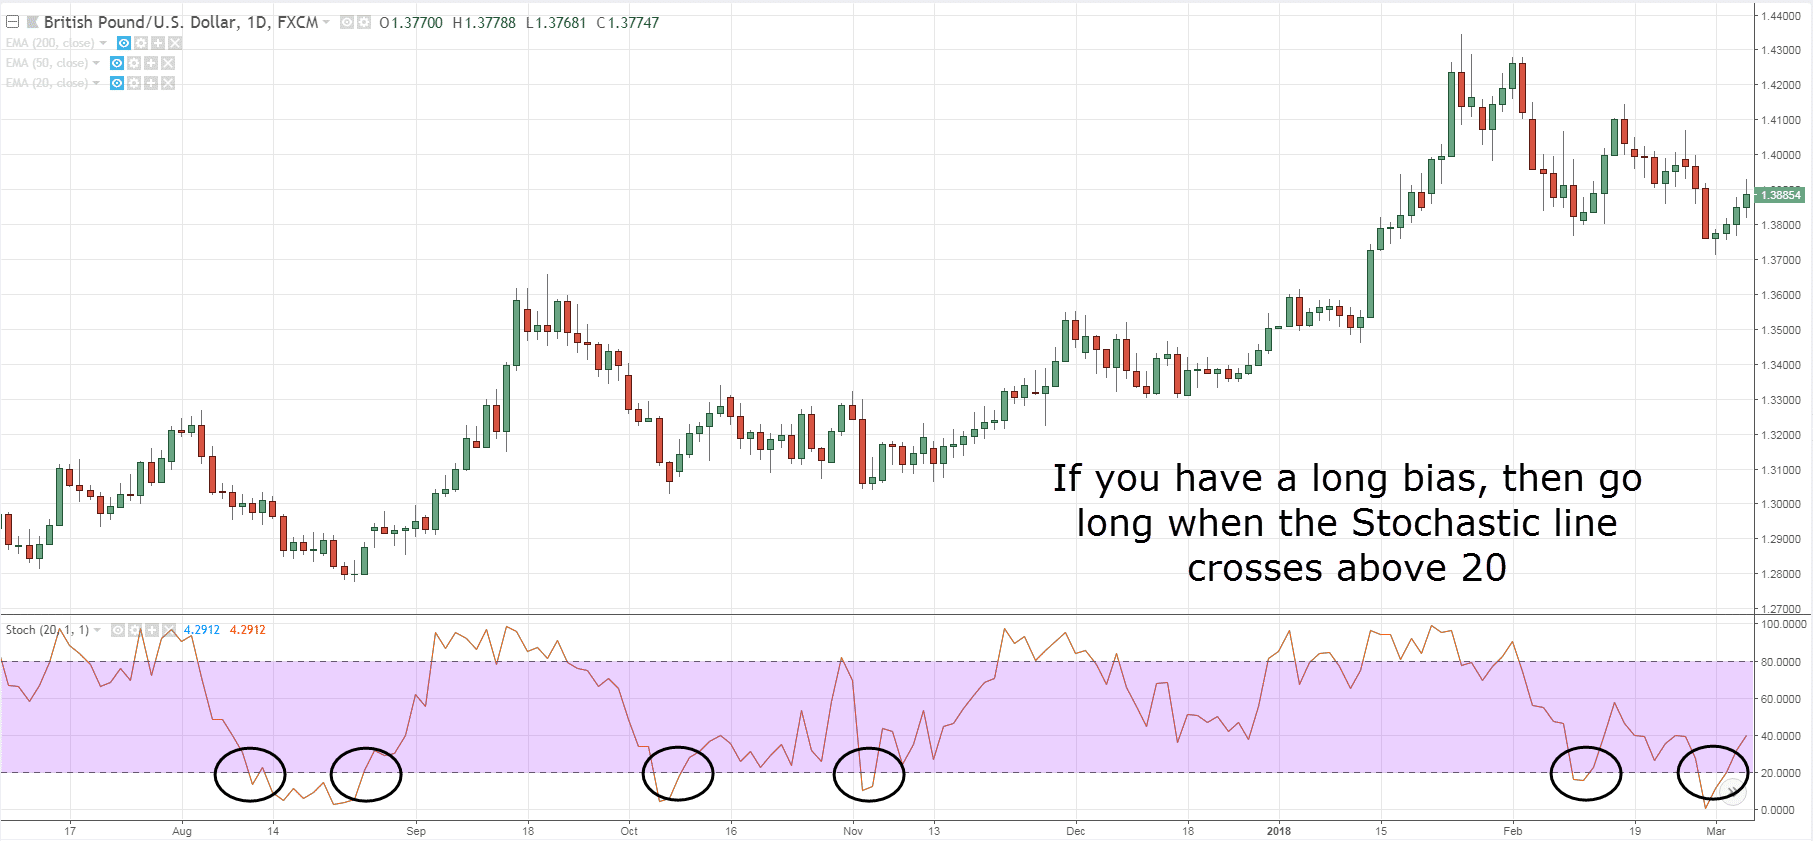
- If you have a long bias, then go long when the Stochastic line crosses above 20
- If you have a short bias, then go short when the Stochastic line crosses below 80
Here’s an example:
Now, what does this means?
Recall:
The Stochastic indicator measures momentum.
So, when you see the Stochastic crossing above 20, it’s telling you bullish momentum is stepping in (and vice versa).
And one important thing:
Don’t mistake this as a trading strategy because it’s not.
Rather, it’s an entry trigger to get you into a trade.
A BIG difference.
Why you don’t need to use Stochastic indicator in a range market
Now:
If you search the internet, books, courses, and etc, they will tell you the best time to use the Stochastic indicator is in a range market.
Why?
Because you can wait for the price to be overbought before shorting (and vice versa)
An example:
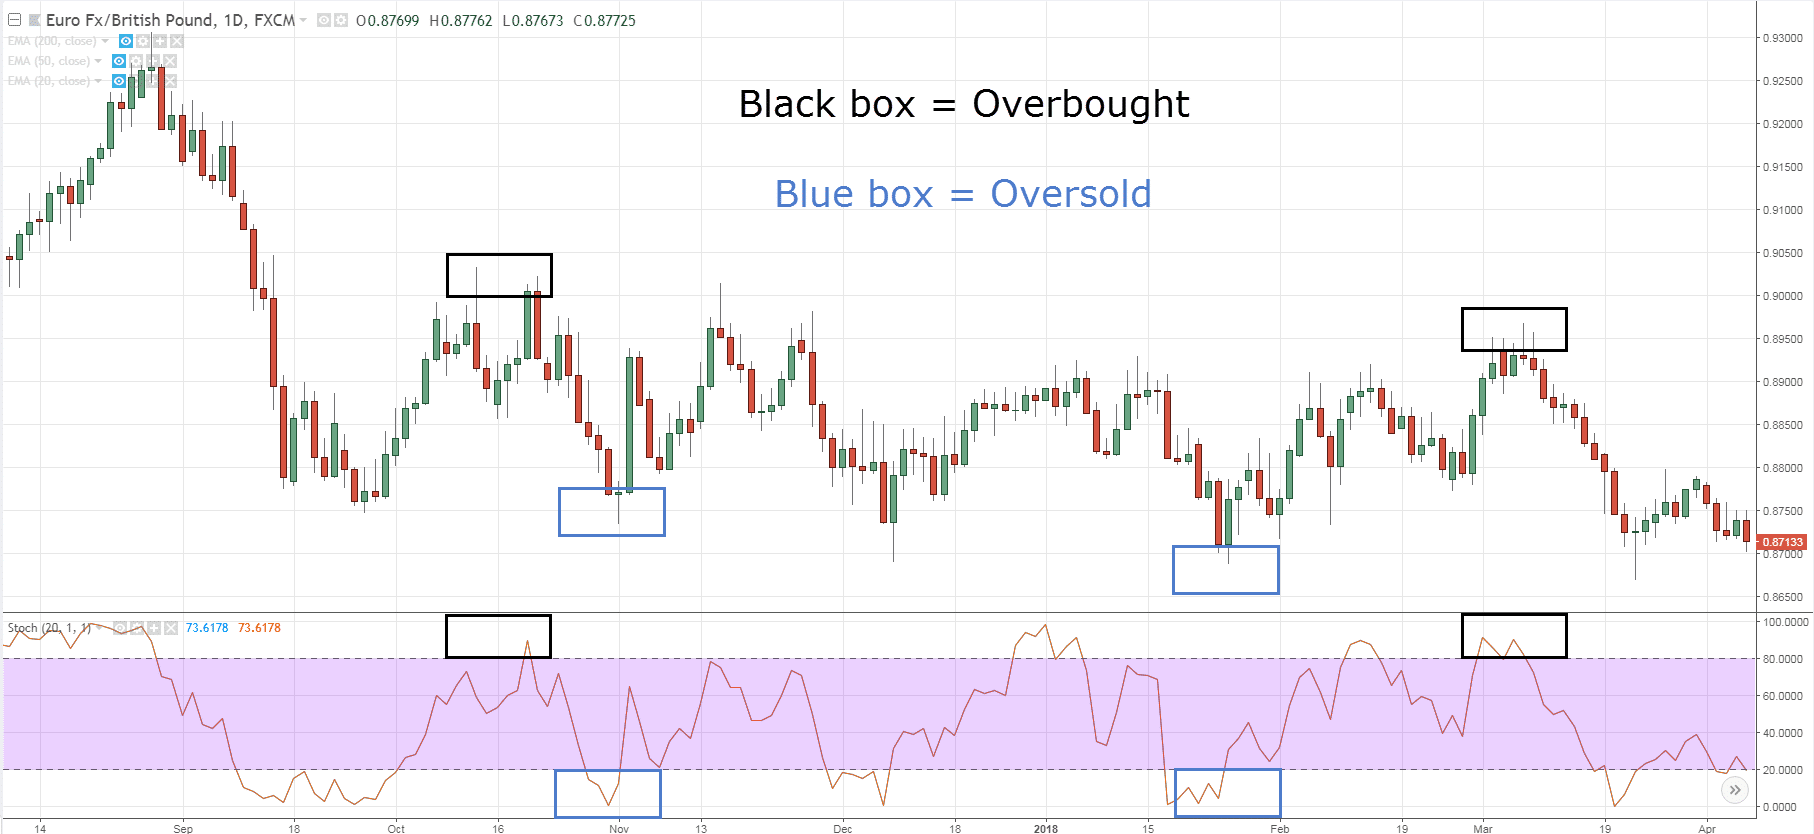
And from the looks of it, it seems that Stochastic indicator can pinpoint the tops/bottoms of a range with deadly accuracy.
But here’s the thing:
Do you REALLY need a stochastic indicator to do so?
Nah.
Because all you need to do is…
Short Resistance.
And voila! You get the same result.
Here’s what I mean:
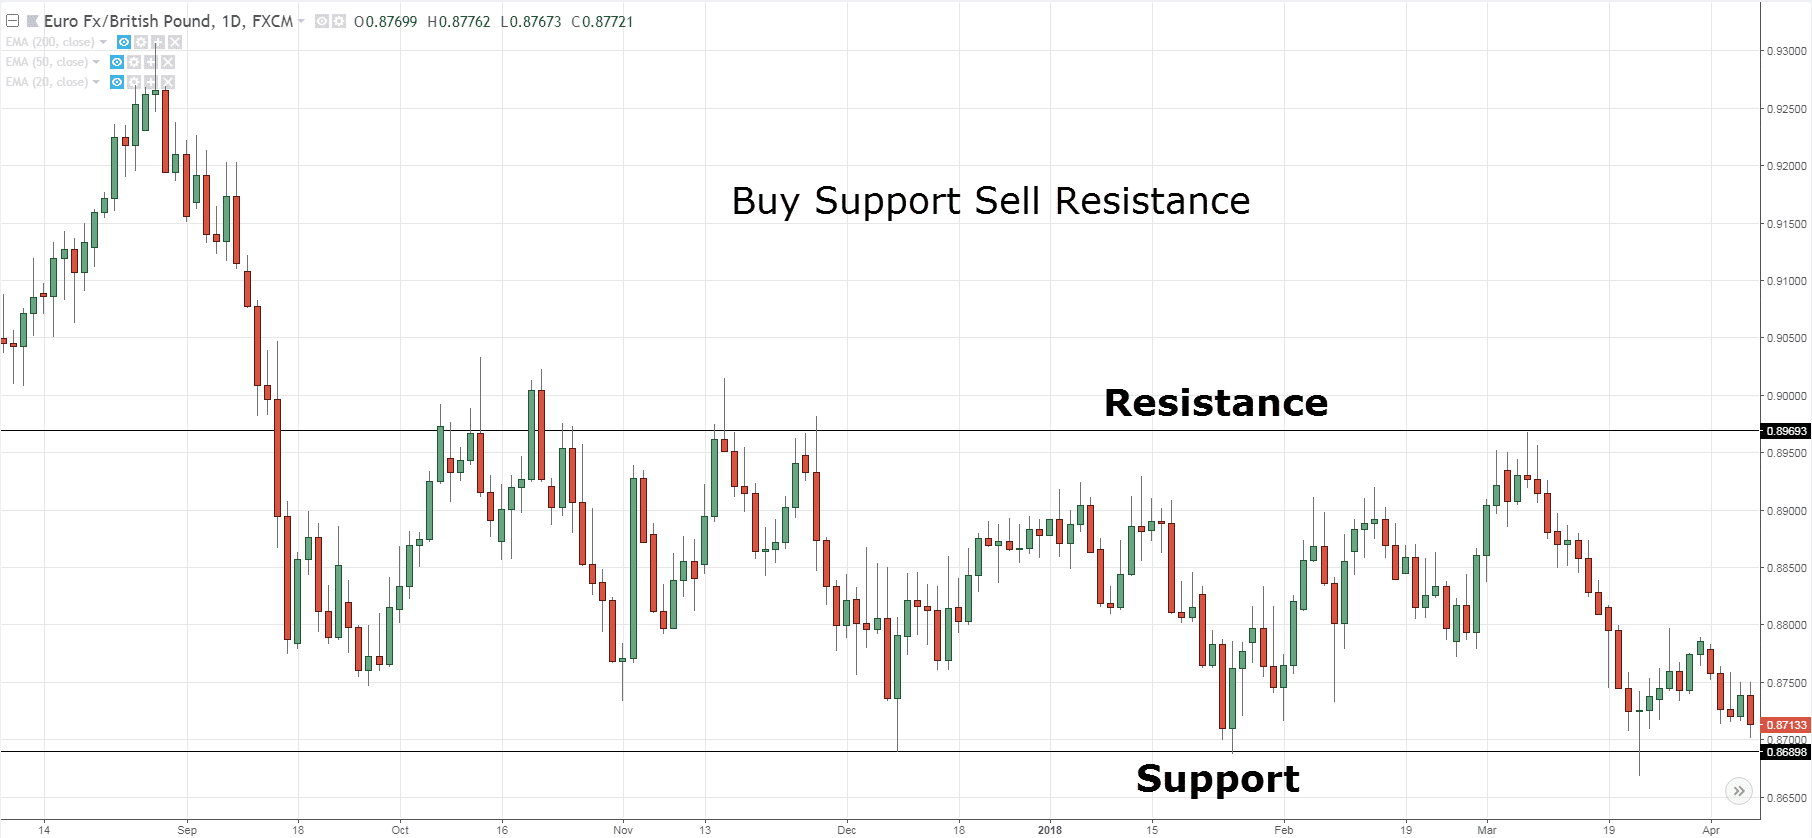
As you can see… you’ve accomplished the same thing as what Stochastic did — but with less clutter on your charts.
Does it make sense?
Awesome!
Frequently asked questions
#1: How can I use Stochastic Indicator to tell me if the market is in a range?
You don’t need to use the Stochastic Indicator to tell you if the market is in a range or not. Because if you find that the price keeps retesting the highs or lows multiple times, then the market is in a range.
Alternatively, when the market is in a range, you’ll observe that the Stochastic Indicator tends to reverse near the 70 area and the 30 area. For example, if the market is in a range, it tends to find support when the Stochastic value is at 30 and it tends to find resistance when Stochastic value is at 70.
#2: Is there a good way to combine the Stochastic Indicator with other indicators?
Yes, it’s possible. Stochastic Indicator is useful to identify area of value on your chart and to serve as an entry trigger.
The first way to go about it is to combine the Stochastic with a moving average:
- Use a moving average to determine the trend
- Use the Stochastic to identify the area of value in the trend
- Then use candlestick patterns to serve as an entry trigger
Alternatively, you can:
- Use a moving average as a trend filter
- Use support and resistance as an area of value
- Then use Stochastic Indicator as your entry trigger
In this case, Stochastic is acting as an entry trigger. So if the market is in a downtrend and the price is at resistance, you can look to sell when the Stochastic crosses below 70.
Conclusion
So here’s what you’ve learned today:
- The stochastic is an indicator that measures momentum
- Don’t go short just because Stochastic is overbought because it can remain overbought for a long time
- Spotting a divergence doesn’t mean the market will reverse. It fails more often than not in a trending market
- In a downtrend, overbought level on Stochastic can help you time when the pullback might end (and vice versa in an uptrend)
- The Stochastic can serve as an entry trigger to go long when it rises above 20 (and short when it cross below 80)
Now here’s my question for you…
How do you use the Stochastic indicator?
Leave a comment below and share your thoughts with me.
Tidak ada komentar:
Posting Komentar