Translate

Break Even EA

EA Break Even & Manajemen Perdagangan yang Keren untuk MT4

Halo, para pedagang, saya menemukan EA manajemen perdagangan yang keren. Ini adalah Penasihat Ahli yang impas untuk platform perdagangan MetaTrader 4 Forex gratis. EA ini memungkinkan Anda untuk menetapkan jumlah, dalam pips, untuk memicu EA memindahkan stop loss Anda ke titik impas, yang membantu pengelolaan uang.

Saya menggunakan Expert Advisor break even ini sepanjang waktu, jadi saya pikir kalian mungkin merasa berguna.

Tidak seperti EA impas lainnya yang saya coba, yang satu ini memungkinkan Anda untuk mengatur titik impas khusus (mengunci pips). Anda dapat mengunci pips positif atau negatif.

Ini berguna karena sebagian besar penasihat ahli impas tidak mengizinkan Anda memperhitungkan biaya spread. Dengan EA ini, Anda dapat mengunci +3 pips, misalnya, untuk menutupi biaya spread dan/atau komisi Anda.

Pada gambar di bawah, saya telah mengatur EA untuk memindahkan stop loss saya 2 pips menjadi profit setelah "pemicu" atau 40 pips profit tercapai.

LockInPipsAt – Ini adalah jumlah pips yang Anda inginkan agar harga berubah menjadi profit sebelum EA memindahkan stop loss Anda ke titik impas.

LockInPips – Ini adalah pengaturan yang saya bicarakan yang memungkinkan Anda untuk mengunci jumlah pip yang Anda inginkan setelah tindakan impas telah dipicu.

Catatan: Seperti yang saya sebutkan sebelumnya, Anda juga dapat mengunci pips negatif. Misalnya, Anda dapat mengatur EA ini untuk mengunci -4 pips setelah peristiwa impas dipicu.

Saya pribadi tidak melakukan ini, tapi saya tahu pedagang lain yang kadang-kadang menyesuaikan stop loss mereka, sementara tidak cukup membawa mereka ke titik impas. Idenya adalah untuk meninggalkan lebih banyak ruang untuk bergerak sambil mengambil beberapa risiko dari meja.

Perdagangan – Dengan pengaturan ini, Anda dapat mengurangi skala perdagangan Anda. Pengaturan 1 berarti stop loss Anda akan dipindahkan ke titik impas saja. Pengaturan 2 akan menutup setengah dari posisi Anda ketika stop loss dipindahkan ke titik impas, dan setengah lainnya ketika nilai "LockInPipsAt" Anda tercapai lagi. Anda dapat menyesuaikan nilai ini hingga 3 paling banyak.

Contoh: Anda menetapkan "LockInPipsAt" ke 40 dan "Trades" ke 3. Jika harga bergerak 40 pip sesuai keinginan Anda, peristiwa impas dipicu dan setengah dari posisi Anda ditutup. Jika harga bergerak tambahan 40 pips (total 80 pips) sesuai keinginan Anda, setengah dari posisi yang tersisa ditutup. Jika harga bergerak 40 pips tambahan sesuai keinginan Anda (total 120 pips), posisi yang tersisa ditutup.

Pesan teks dengan pemicu yang Anda pilih, kunci keuntungan, dan (jika diaktifkan) nilai skala ditampilkan di bagian atas grafik. Nilai FontSize dan FontColour mengontrol visibilitas pesan.

Sebelum ada yang bertanya, saya tidak sepenuhnya yakin apa yang dilakukan ModifyTrades dan ModifyTrade3 . Saya sudah mencoba menyesuaikan keduanya sebelumnya, tetapi saya tidak melihat perbedaan dalam cara kerja Expert Advisor ini.

Saya hanya menggunakan EA break even ini untuk memindahkan stop loss saya ke titik impas (+2-3 pips), sesuai dengan aturan sistem trading saya . Saya tidak pernah menggunakannya untuk menskalakan, jadi Anda mungkin harus sedikit bereksperimen untuk memahami sepenuhnya semua fitur-fiturnya.

Agar EA BreakEven_v2 mengubah perdagangan Anda secara otomatis, Anda harus memastikan bahwa "Izinkan perdagangan langsung" dan "Izinkan impor DLL" dicentang di bawah tab Umum dari EA impas (lihat gambar di atas).

Anda dapat memeriksa pengaturan ini ketika Anda menyeret indikator ke grafik Anda, atau Anda dapat menarik "Properti" EA Anda ( Klik Kanan > Expert Advisors > Properties atau F7 ) jika titik impas Expert Advisor sudah terpasang pada grafik Anda.

Untuk memastikan pengaturan ini selalu dicentang secara default saat Anda menambahkan EA baru, buka “Opsi” MT4 Anda ( Alat > Opsi atau Ctrl+O ). Pastikan "Izinkan perdagangan otomatis" dan "Izinkan impor DLL . . .” diperiksa.

Terakhir, pastikan tombol “AutoTrading” diaktifkan ( Ctrl+E ) di bagian atas platform. Jika semuanya bekerja dengan benar, Anda akan melihat wajah tersenyum di sebelah nama EA di sudut kanan atas grafik Anda.

Instruksi instalasi:
  1. Unduh dan ekstrak EA BreakEven_v2 .
  2. Tempatkan di folder “Experts” Anda ( File > Open Data Folder > MQL4 > Experts ).
  3. Mulai ulang MT4.
  4. Buka jendela “Navigator” Anda, jika belum terbuka ( Ctrl+N ).
  5. Tarik EA impas ke grafik Anda.
  6. Sesuaikan pengaturan (lihat petunjuk di atas) dan warna, jika perlu, dan tekan tombol "OK".
  7. Pastikan Perdagangan Otomatis diaktifkan ( Ctrl+E ).
Keindahan dari EA impas ini adalah Anda dapat menerapkannya ke grafik Anda dan pergi. Jika Anda sudah membaca untuk sementara waktu, Anda tahu saya benci duduk di depan grafik saya terlalu lama. Itulah salah satu alasan saya mengalihkan sistem perdagangan utama saya ke Day Trading Forex Live .

Apa pun jangka waktu yang Anda perdagangkan, Expert Advisor impas ini dapat membantu menghemat waktu dan tenaga Anda sambil menjaga sistem perdagangan Anda seakurat dan seakurat mungkin. Saya harap kalian menemukan titik impas gratis dan EA manajemen perdagangan ini berguna seperti yang saya miliki selama ini. Silakan bagikan dan beri komentar!

Apakah Anda masih mencari sistem perdagangan yang menguntungkan ? Saya baru-baru ini mengubah sistem perdagangan utama saya setelah menguji yang baru selama lebih dari setahun. Mari lihat mengapa saya beralih ke Day Trading Forex Live .

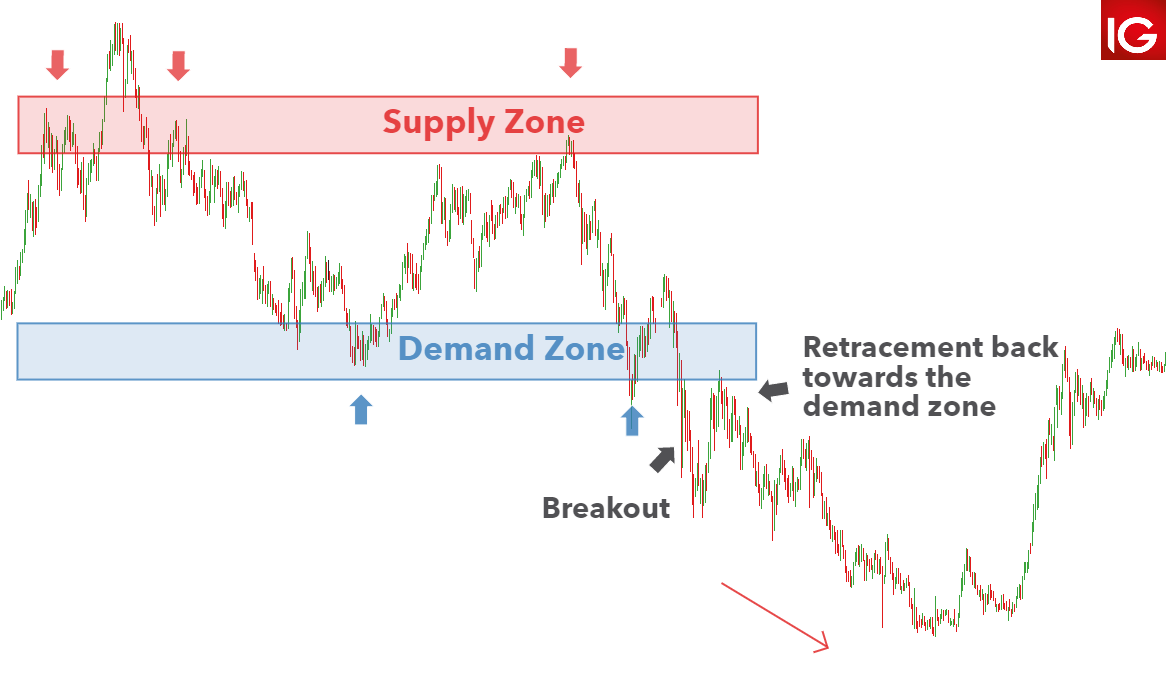
Supply dan Demand


Supply dan Demand


Di dunia trading forex tentu kita pernah mendengar istilah supply dan demand. Supply yang berarti penawaran dan demand yang merupakan permintaan akan terjadi ketika ada barang yang dijual maupun barang yang dibeli.

Hal ini juga berlaku dalam pasar forex yang menjadi tempat bertemunya penjual dan pembeli valas. Supply dan demand mungkin bukan hal yang besar ketika berbicara dalam lingkup trader profesional, namun bagaimana supply dan demand dalam lingkup trader pemula yang notabene baru dalam dunia trading?

Konsep Dasar Trading Supply dan Demand
Sebelum masuk dalam hubungan supply dan demand dalam trader pemula, kita harus mengetahui konsep dasarnya terlebih dahulu. Supply adalah jumlah barang yang tersedia pada satu waktu di pasar, sedangkan demand adalah jumlah barang yang diinginkan pada satu waktu. Agar lebih paham, mari kita menelaah contoh kasus berikut ini. Suatu barang mengalami peningkatan pada supply-nya, sedangkan jumlah permintaannya tetap stabil. Maka yang terjadi dari sisi pedagang adalah terjadi siklus pertukaran uang dan pembaharuan barang yang dapat diindikasikan bahwa pedagang telah mengalami kerugian karena barang tidak laku.

Agar tidak mengalami kerugian yang semakin membesar, pedagang akan menurunkan harga agar minat pembeli dapat kembali naik. Sebaliknya kurangnya ketersediaan barang dan tingginya permintaan akan menaikkan nilai barang tersebut. Singkatnya, konsep yang dapat disimpulkan dari keterkaitan diatas adalah: Jika demand naik dan supply tidak berubah maka kelangkaan barang akan terjadi sehingga harga barang akan naik. Saat demand menurun dan supply tidak berubah maka penumpukan barang akan terjadi dan harga akan turun. Jika demand tetap dan supply meningkat maka penumpukan barang akan terjadi dan harga akan turun. Saat demand tetap dan supply turun maka kelangkaan barang akan terjadi dan harga akan naik.

Konsep dasar supply dan demand sangat penting dipahami oleh para pemula. Ketika trader pemula dapat memahami konsep dasar ini dan konsep dasar lainnya, tidak menutup kemungkinan trader akan dapat membaca pergerakan pasar hingga ke akarnya.

Jenis Entry Trading Supply dan Demand

Terdapat dua hal yang akan menjadi dasar entry dalam cara trading pemula dengan supply dan demand. Kedua jenis entry ini menawarkan kekurangan dan kelebihannya masing-masing.

Entry Breakout
Pada jenis entry breakout, order akan dieksekusi langsung ketika harga telah berhasil menembus suatu resistance ataupun support. Entry jenis ini sering digunakan pada sistem trading dengan menggunakan Channel seperti Bollinger Bands, Donchian Channel ataupun pada Chart Pattern. Kelebihan jenis entry breakout adalah trader tidak akan pernah tertinggal ketika harga sedang trending dalam satu arah. Breakout jenis ini memang sangat baik untuk mendeteksi pergerakan awal suatu pasar trending. Kelemahan dari jenis entry breakout adalah false breakout. False breakout merupakan seuatu kejadian yang pada awalnya akan mencerminkan penembusan harga dari support dan resistance, tetapi kemudian gagal karena harga tidak mempertahankan eksistensinya diluar support dan resistance.

Malahan harga akan kembali naik ketika menembus level harga. False berakout sering kali dapat menipu dan menghabiskan dana trader, terutama trader tanpa perhitungan money management yang baik.

Entry Pullback
Pullback adalah sejenis entry setelah breakout. Dalam hal ini trader harus terlebih dahulu menunggu sebelum masuk dalam satu posisi. Memang belum bisa dipastikan bahwa breakout sudah valid atau belum namun dengan menunggu hingga harga melakukan pullback, kita akan mendapatkan harga yang lebih baik dengan resiko rendah dan reward yang lebih tinggi. Intinya, tingkat keberhasilan dari entry pullback bisa lebih baik dibandingkan entry breakout.

Ini merupakan trading untuk pemula yang memang masih berada dalam level rendah. Selanjutnya jika anda sudah merasa mahir dalam bertrading maka anda dapat melakukan trading supply dan demand maka anda bisa melanjutkan ke level yang lebih tinggi.


Hal : Permohonan surat pindah Siswa

Jambi, 27 Juni 2020

Kepada yth

Bapak kepala sekolah SMKN 9 Muaro Jambi

di

        Jambi

Bersama ini kami sampai kepada bapak nama saya Netty Purwanti, saya adalah ibu dari Mas Muhammad Abdi Suryanto siswa kls 1 TBSM 2 SMKN 9 Jambi. Dalam hal ini kami  mau memindah sekolah anak kami tersebut ke SMK di Padang.

Oleh karena itu mohon kiranya bapak untuk dapat mengeluarkan surat pindah anak kami Mas Muhammad Abdi Suryanto dalam status naik ke kls 2

Demikianlah surat permohonan ini kami buat dengan sesungguhnya. Dan  atas perhatian dan pertimbangan bapak kami ucapkan terima kasih

Hormat kami


        Netty

Break Even Forex

The large MAJORITY of Forex traders all around the world make more than 50% winning trades.

The large majority of these exact same traders also go on to consistently lose money. FXCM recently carried out a study of 43 million trades from Q2 2014 – Q1 2015 to look at trader stats and some super surprising results came out.

You Can Make Profits!
I have discussed in the past how traders are A LOT MORE profitable than the wider trader population thinks and how the myth about only the elusive 5% making money is rubbish. You can read a lesson I published a while back on this at Is the 5% Myth True – Do 95% of Traders Fail?, which shows a list of brokers having trader profitability rates as high as 40%+ in some cases, but nearly all being over 30%+.

The problem with those figures is they do not show long-term profitability rates or follow the same account holders, so one account holder could make a large profit for months in a row and then drop off the edge into account draw-down. BUT it does show profits are being made all the same, and also illustrates how profits are not just for some special group of people with a secret access key.

It proves to you that you can make profits, showing how huge percentages of the markets are doing it every single day.

43 million trades is just enough to call a sample size ?. There are two super interesting stats that jump out right away from these trades:

Those are HUGE results right there to sit up and take notice of ? !

But still traders who know how to make winning trades lose money.

Note: You can find the full post written by the DailyFX's David Rodriguez that looks at these 43 million trades HERE.

Bread, Milk, Oil & Houses = Business

The elephant in the room and obvious question is why do these traders getting winner after winner not make profits? The answer is simple: their wins are not covering their losses. The same as in any business right?

If you are selling bread or milk or oil or houses, if you charge less than what you paid you will very quickly find yourself out of business, because you will be losing money. Same principle right?

You know this already. What you do need to know though before we move on is that as a trader you have two options: will you be a high win rate or a high reward trader?

It makes a huge difference which you choose to be. Both have their positives and negatives.

As a high win rate trader you are going to aim for more wins with a smoother equity curve and potentially smaller risk reward trades. If you are a high reward trader you will look for high reward setups and be prepared to take on more losses in search of those rewards. I highly recommend reading the lesson on this to help make your decision at;

Is it Better to Use High Risk Reward or High Win Rate? HINT: High Profits Are the Difference


Flip of the Coin, or 50/50 Choice

It is really not all that surprising to see that traders with a bit of education are able to average a tick over 50% win rate. When you think about it, it is actually more surprising that traders lose as consistently as they do, even though they have what is a winning edge over the market.

If you take away the spread/commissions, then the only options are to go long or short; a 50/50 option. This is a flip of the coin choice. A monkey could take this coin and get 50% winners and so a trader with some education could increase that to above 50%.

Where it becomes more challenging and tricky is after the trade has been placed and you have to manage it. The best way to overcome this is by using a pre-trade plan that marks out exactly how you are going to manage your trade, so that once in it all you have to do is follow your plan.

I go in-depth about how to use a pre-trade plan in the trading lesson here:

How You Can Start Increasing Your Profits With Trade Management Planning

What is Breakeven Trading?

The online dictionary merriam-webster.com defines breakeven as:
Definition of breakeven

: the point at which cost and income are equal and there is neither profit nor loss; also : a financial result reflecting neither profit nor loss


The explanation above explains breakeven really well in general terms.

Breakeven in Forex trading works by you moving your stops from your first stop position into your original entry position once price has moved in your favor. If price then turns around on you and stops you out, it will stop you out at your new ‘Breakeven’ stops. Because this is set at the same price you entered at, you will not lose any money. Make sense? If not, comment below…

Breakeven is a trade management strategy that a lot of traders don’t learn soon enough. The basics of breakeven trading can be used in the rest of your trade management, as I am about to show you in the next section.

When Should You Use Breakeven Stops?

How do you normally manage your trades? There are many different market types and situations and breakeven stops can help you manage your trades to protect your crucial capital. They can also allow you to make ‘free trades’, looking for those bigger potential profit trades.

Below I have covered just a few of the different strategies you could look to implement and use in your own trading with the breakeven method. These will allow you to protect your capital in the different market types.

Protecting Capital

One of the best strategies for using the breakeven strategy is protecting your capital. As I explained when outlining how the breakeven works, the basic mechanics of this method are straightforward – you move your original stops into your entry position when price moves in your favor.

FREE TRADES – The Best of Worlds!

This simple act of moving to breakeven and protecting your trade from being stopped out could be a ‘Game Changer’ for a lot of traders.

The reason for this is because it will all of a sudden open up a whole heap of doors and opportunities that they have never seen or noticed before. What doors exactly?

You don’t just have to move to breakeven and protect capital. You can look for ‘FREE TRADES’. What are free trades? These are the best sorts of trades available.

Say for example you are in a trade and you have taken profit target 1. You now move the rest of your position to ‘Breakeven’. You are in a ‘FREE TRADE’. You have cashed in part profit, you cannot lose on the rest of the trade and whatever happens is all profit, but either way – you cannot lose.

CHART EXAMPLES

The chart below explains both of these two breakeven strategies. At the high sticking out and away from all other price we have a bearish pin bar reversal. To enter this pin bar we need to set our entries just below the low of the pin bar to enter when price breaks lower.

As you can see on the chart, back to the left is a previous resistance level. Keep in mind when entering the pin bar at the time we would not have all the price action information that we have on the chart now. We would only be able to see that we are trading into a potential ‘price flip' or support level.

This could be an area where you may look to potentially protect your capital. You could do this by moving your stops from where they were originally above the pin bars high into ‘Breakeven', which is as we know the price you entered.

If price hits the price flip & support level & turns around to stop you out, you will lose nothing because you have protected your capital.

CLICK TO TWEET

This is the beauty of the free trade and there are many combinations you can choose to work, depending on your style, comfort levels and particular trading temperament. You may choose you want to take 1/3 profit off the table at this level so as to cash in some profit and then move the rest to breakeven. It really is up to you. See chart below:

Chart Example 1


Different Market Types – Manage Differently
The last point I wanted to touch on with the breakeven strategy that I know would really help you is discussing the different market types. I want to make sure that when you are looking to implement your breakeven stops you take into account what sort of market you are trading in because this is SUPER IMPORTANT.

A major mistake a lot of traders make is treating all markets the same when managing their trades. Something we teach our members in the members price action trading courses is to manage their trades according to the different market types. That is what I want you to do with your breakeven strategy as well.

For example, if you’re making a trade in a tight and ranging market, then you’re going to need to protect your capital a lot closer than in a strongly trending and free flowing market.

Because price is ranging there are going to be a lot more support and resistance levels and price will be a lot more inclined to chop up and down, so make sure to keep this in mind.

You will notice in the chart examples below the super obvious and clear differences in the price action stories of the two charts. The first chart is making clear lower highs and lower lows and the second chart is caught in a sideways range that is very choppy.

If you were to manage these two markets the same, with the same trade management methods you may just come out with really great results once or twice, BUT overtime those results would leave a lot to be desired and the reason for that is because as just discussed above and as you can clearly see from the examples below; there are clear differences between market types.
YOU CAN set rules around these market differences and create plans pretty simply.

Chart Example 2


Chart Example 3


50%+ or Profits?

Could breakeven trading be just the thing you need to turn your trading around or lift you over the edge into profitability?

Trade management is something that we ALL have to continually work and practice on. The fact is that the trader who makes the best decisions on a consistent basis will come away with the treats from the cookie jar.

Think about it like this: if the majority of traders are averaging above 50% winners, then whoever makes the best decisions over the longest amount of time is going to come out on top EVERY SINGLE TIME.

If I can use Breakeven trading to protect my capital, make free trades & make big runners/profits and help manage trades in different market types, then I am most definitely going to do so.

If you need any clarification on anything in today’s trading lesson, you have any questions or you want to make any comments, then I WOULD LOVE TO HEAR FROM YOU in the comments section below!

Pengenalan Bahasa MQL

Bahasa MQL? Apa sih itu? Bila anda belum pernah dengar apa itu bahasa (bahasa pemrograman) MQL, anda berarti sama seperti orang kebanyakan. Banyak trader forex hanya tahu tentang indicator dan Expert Advisor (EA), tapi saat ditanya bahasa MQL, mereka tidak tahu. Sebenarnya apa sih bahasa MQL itu? MQL (MetaQuotes Language) adalah bahasa pemrograman untuk memprogram EA, Indicator ataupun script yang nantinya bisa digunakan pada platform Meta Trader. Ada beberapa versi dari MQL dan yang paling banyak digunakan adalah 2 versi terakhir yaitu MetaQuotes Language 4 (MQL4) dan MetaQuotes Language 5 (MQL5). Bahasa pemrograman MQL ini sendiri biasanya digunakan untuk membuat :

  • Expert Advisor EA atau banyak dikenal orang sebagai robot adalah program yang berjalan seiring dengan gerakan harga pada market. EA sendiri punya banyak fungsi. Ada yang berfungsi memberikan sinyal saja sampai dengan melakukan eksekusi seperti memasang posisi baru ataupun menutup posisi secara otomatis.EA tersimpan di folder \experts dalam folder MetaTrader anda.
  • Custom Indicator Selain indicator bawaan dari MetaTrader, kita juga bisa membuat indicator sendiri (custom indicator). Sedikit berbeda dengan EA yang bisa memasang posisi dan menutup posisi, indicator hanya berfungsi sebagai alat analisa saja. Indicator tidak dapat memasang posisi ataupun menutup posisi secara otomatis.Custom Indicators tersimpan di folder \experts\indicators dalam folder Meta Trader anda.
  • Script Script adalah program yang dijalankan sekali saja saat diaktifkan. Tidak seperti EA, Script tidak akan bisa berjalan mengikuti harga yang sedang berjalan. Script biasanya diaktifkan dengan cara mengclick script tersebut.Scripts tersimpan di folder \experts\scripts dalam folder Meta Trader anda.
  • Library Library adalah sekumpulan fungsi program yang biasanya sering digunakan. Library ini biasanya merupakan salah satu bagian dari Script / EA / Indicator.Libraries tersimpan di folder \experts\libraries dalam folder Meta Trader anda.
  • Included file Included file adalah file yang berisi bagian teks-teks yang sering digunakan pada pembuatan sebuah program. Secara fungsi, included file mirip seperti library. Included file ini nantinya dapat dimasukkan pada EA, scripts, custom indicator ataupun library pada saat compile. Penggunaan included file lebih disukai programmer karena penggunaan library biasanya memberikan beban ekstra pada saat EA / indicator / script dijalankan.Included files tersimpan di folder \experts\include dalam folder Meta Trader anda

Bagi yang pernah belajar bahasa pemrograman C++ mungkin akan sedikit terbantu saat belajar mengenai bahasa pemrograman MQL, karena banyak syntax dari bahasa MQL mirip dengan syntax dari bahasa C++. Satu-satunya kelemahan dari MQL mungkin adalah tidak adanya debugging untuk melacak step by step program yang dibuat. Okay… Sebagai pengenalan, kita akan langsung masuk ke dasar-dasar dari pemrograman MQL.

Struktur Program MQL

Untuk dapat memahami bagaimana suatu program ditulis, maka struktur dari program harus dimengerti terlebih dahulu. Setiap bahasa pemrograman punya struktur yang berbeda. Program MQL ini mirip seperti kumpulan fungsi seperti halnya C++. Fungsi yang harus ada di MQL adalah start(). Suatu fungsi di program MQL dibuka dengan kurung kurawal ({)dan ditutup dengan kurawal tutup (}). Di antara kurung kurawal dapat dituliskan statement-statement program MQL. Berikut adalah struktur dari program MQL.

#property copyright "Pembuat EA"
#property link      "Alamat Website"

int init()
{
     statemen-statemen;
     return(0);
}

int deinit()
{
     statemen-statemen;
     return(0);
}

int start()
{
     statemen-statemen;
     return(0);
}

Deklarasi Variabel & Tipe Data

Variabel adalah suatu pengenal yang digunakan untuk menyimpan suatu nilai dan nilai variabel dapat berubah-ubah selama proses dalam program. Variabel harus mempunyai nama supaya program dapat menggunakan nilai yang tersimpan di dalamnya. Variabel dalam MQL sendiri bisa dideklarasikan dalam beberapa tipe data. Ada beberapa jenis tipe data pada program MQL, yaitu :

bool

– tipe data boolean yang berisi antara true dan false

color

– tipe data untuk warna – pilihan warna yang bisa digunakan bisa dicek di sini.

datetime

– tipe data tanggal dan jam

double

– tipe data float (bilangan bulat dan koma)

int

– tipe data integer (bilangan bulat) dari -2 milyar sampe +2 milyar / tipe data karakter 1 digit

string

– tipe data teks

Selain tipe data di atas, ada juga tipe data array untuk menampung beberapa data sekaligus dalam 1 variabel. Untuk array, akan saya jelaskan lebih lanjut di bagian advance nantinya.

Berikut adalah contoh cara mendeklarasikan variabel dalam program MQL :

extern bool status = true;
static color warna = 0xFFFFFF;
datetime tgl = D'1980.07.19 12:30:27';
int i = 1;
int karakter = 'A';
double d = 1.4211;
string s = "Ticket # 12345";
double f[] = { 0.0, 0.236, 0.382, 0.5, 0.618, 1.0 };

Penggunaan extern di depan deklarasi variabel biasanya digunakan agar variabel dapat juga berfungsi sebagai input dan bisa diakses dari window property EA di Meta Trader.

Contoh bila kita membuat variabel seperti di bawah ini :

Screen shot 2014-01-22 at 4.15.30 PM

Maka bila di properties dari EA kita akan muncul seperti di bawah ini :

Screen shot 2014-01-22 at 4.15.45 PM

Penggunaan static di depan deklarasi variabel biasanya digunakan untuk mendeklarasikan konstanta di mana nilainya tidak bisa berubah-ubah seiring dengan berjalannya proses program.

Catatan : Nama variabel di MQL bersifat case sensitive, sehingga variabel Periode_MA berbeda dengan periode_ma.

Adapun ada beberapa aturan dalam memberi nama variabel yaitu :
– Panjang nama variabel maksimal adalah 31 karakter
– Harus diawali huruf besar, huruf kecil atau _ (tidak bisa angka atau simbol lain selain _ )
– Tidak bisa menggunakan keyword (contoh keyword : bool, color, extern, static, case, else, if, true, false dan lain-lain)

Keyword sebagai Standard Constants

Untuk lebih mempermudah penulisan program, MQL telah mempunyai semacam konstanta yang sudah ada dalam program. Konstanta ini biasanya sering dipakai saat kita hendak menuliskan nilai-nilai tertentu mulai dari market price, timeframe, jenis pemasangan posisi, arrow, dan masih banyak lagi . Semuanya dapat anda akses hanya dengan menuliskan nama konstantanya. Semua konstanta di sini bertipe int. List lengkap standard constants dapat dilihat di sini.

Contoh penggunaan Standard Constants (yang berwarna biru) :

OrderSend(Symbol(),OP_BUY,1,Ask,3,0,0,"My order #1",1,0,Green);
if(ma1tp){if(Ask<ma1)close(OP_BUY);if(Bid>ma1)close(OP_SELL);}
double ma2=iMA(NULL,0,maperiod2,0,MODE_EMA,PRICE_CLOSE,shift);

Catatan / Komentar pada Program

Seperti halnya di semua bahasa pemrograman, anda juga bisa memberikan catatan atau komentar pada bahasa MQL. Comment di sini tidak akan dibaca oleh program dan hanya berfungsi sebagai petunjuk atau catatan bagi programmer untuk lebih mengerti mengenai program yang dibuat.

Cara penulisan komentar pada program MQL ada 2 yaitu :
1. Tambahkan // di awal komentar
2. Gunakan /* */

Contoh :

int jumlah_lot=1; // Total Lot untuk pasang posisi

atau

/* Total Lot untuk pasang posisi */
int jumlah_lot=1;

Operator Aritmetika & Assignment Operator

Operator yang digunakan pada bahasa MQL ini sangat mirip dengan bahasa C++. Berikut adalah beberapa contoh penggunaan operator aritmetika :

A=B+C //A = B ditambah C
A=B-C //A = B dikurangi C
A=B*C //A = B dikali C
A=B/C //A = B dibagi C
A=B%C //A = Sisa pembagian setelah B dibagi C. Misalnya 10 % 3 = 1;

A++; //versi singkat dari operasi A=A+1
B--; //versi singkat dari operasi B=B-1

A=B*5; //isi dari A sama dengan B dikali 5
A+=5; //versi singkat dari A=A+5
A-=5; //versi singkat dari A=A-5
A%=5; //versi singkat dari A=A%5;

Selain semua operator aritmetika di atas, kita juga perlu mengetahui beberapa operator pembanding, yaitu :

== : sama
!= : tidak sama
< : lebih kecil dari > : lebih besar dari
<= : lebih kecil dari atau sama dengan 
>= : lebih besar dari atau sama dengan

&& : dan
|| : atau
! : not

Operator pembanding ini biasanya sering digunakan pada penyeleksian kondisi, contohnya :

if (a==b) { } //kalau a sama dengan b
if (a>b) { } // kalau a lebih besar dari b
if (a!=b) { } // kalau a tidak sama dengan b
if (a==b && c<d) { } //jika a sama dengan b dan c lebih kecil dari d 
if (!a==b || c>=d) { } //jika a tidak sama dengan b atau c lebih besar 
atau sama dengan d

Fungsi-Fungsi Dasar

Setelah tahu mengenai variabel, tahap berikutnya adalah mengenal fungsi-fungsi dasar dari bahasa MQL. Fungsi-fungsi dasar ini biasanya adalah seperti fungsi untuk menampilkan hasil di layar, fungsi untuk pasang posisi (BUY / SELL) dan beberapa fungsi lainnya. Semua referensinya dapat dilihat di link berikut ini :

Fungsi Umum – Fungsi umum untuk menampilkan tulisan pada layar, menampilkan message box, dll
Fungsi Trading – Fungsi yang berhubungan dengan pasang / tutup posisi, mengecek order yang ada, dll
Fungsi Harga – Fungsi untuk mendapatkan nilai close, high, low, open dari harga.

Sebagai sedikit pengenalan bagi yang baru belajar, berikut adalah beberapa fungsi yang sering sekali saya pakai saat membuat EA.

– Fungsi untuk menampilkan tulisan pada layar

Comment("Teks yang ingin ditampilkan di layar");

– Fungsi untuk mengecek jumlah order yang sudah dipasang

OrdersTotal()

– Fungsi untuk mengecek nilai harga dari market

iClose(Symbol(),0,1)

– Fungsi untuk mengecek jumlah order yang sudah dipasang

AccountFreeMargin()

– Fungsi untuk memasang posisi baru (bisa BUY / SELL)

OrderSend(Symbol(), OP_BUY, var_jml_lot, Ask, var_slippage, 
Bid-var_stoploss*Point, Ask+var_takeprofit*Point, 0);
OrderSend(Symbol(), OP_BUY, var_jml_lot, Ask, var_slippage, 
Bid-var_stoploss*Point, Ask+var_takeprofit*Point, 0);

Decision (Penyeleksian Kondisi) & Looping (Perulangan)

Di dalam program, selain statemen dari fungsi-fungsi yang dijalankan berurutan, juga ada statemen yang memungkinkan program untuk melakukan tindakan tertentu berdasarkan kondisi ataupun melakukan proses perulangan berdasarkan kondisi tertentu. Decision dan looping adalah inti dari sebuah program komputer.

Statemen yang umum biasanya digunakan adalah untuk proses penyeleksian kondisi (IF) dan proses perulangan (Do While). Di dalam MQL, hal ini juga bisa dilakukan. berikut adalah contoh-contoh statemen tersebut :

if(p!=x && p>y) Comment("TRUE");
if(!a) Comment("not 'a'");
for(i=0,j=99; i<100; i++,j--) Comment(array[i][j]);
if(Month() == 12)
  if(Day() == 31) Comment("Happy New Year!");

Buat yang ingin belajar mengenai bahasa pemrograman MQL lebih jauh dapat mengunjungi website berikut ini :
MQL4 Online Resources – http://book.mql4.com/
MQL4 eBook – http://www.mql4.com/files/MQl4BookEnglish.chm

MQL5 Online Resources – http://www.mql5.com/en/docs
MQL5 eBook – https://www.mql5.com/files/pdf/mql5.pdf

SUMBER

Forex Trading For Living

Posted on

Sension waktu trading


The Best Trading Session Indicator for MetaTrader 4 (MT4)


The indicator that I want to show you in this tutorial is absolutely, hands down, the best trading session indicator for MetaTrader 4 (MT4). I use this indicator every day, and I cannot go back to trading without it.

Some of you may have heard of the i-Sessions indicator before, but in this tutorial, I’m going to show you how to get all the information you need from this useful indicator while keeping your charts as clean as possible. This is how I use i-Sessions, and after seeing this, you’ll probably wonder how you traded without it as well.


Of course, this indicator is only really useful if you trade on time frames lower than the 4 Hour. I use it on the 15 Minute and 1 Hour charts, and it has become a very useful part of my trading routine.
The Best Trading Session Indicator for MetaTrader 4 (MT4)

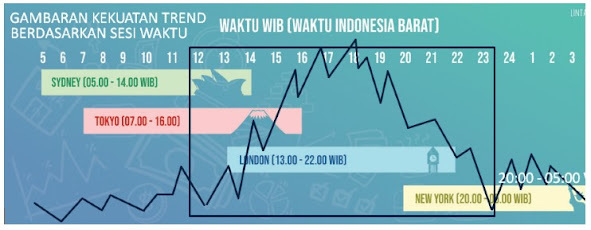
Which trading session(s) should you trade in the Forex market? Depending on your trading system, you could trade in any session; however, most traders will find the London and New York sessions to be preferable.

The Asian session can be very difficult to make money in. There are many reasons for this, which I will discuss in a future article. Keep in mind that I’m dividing the market into just three sessions, i.e., the Asian, London, and New York sessions, although the market could be divided into many more sessions.

Most traders lump all the trading sessions into these three. The session times that most traders actually care about are the London open/close and the New York open/close. That’s where the i-Sessions indicator comes in handy.


You can easily see when the important sessions start and end – without cluttering your chart.

In the image above, you can see the i-Sessions trading session indicator for MetaTrader 4 (MT4) in action. Being able to determine what trading session you are in at a glance can be very useful to you if you’re an intra-day trader. This information is even more useful when you’re manually backtesting a new trading strategy because you don’t have to count candles/bars to determine what session a setup occurred in.


Note: As you can see, I’ve got my period separators visible as well (Ctrl+Y). I like to use them when I’m daytrading, but they aren’t necessary as long as you have your session boxes set correctly.

Normally this indicator shows three colored, overlapping boxes that highlight the three major trading sessions. However, I’ve configured it to include the Sydney open in the “Asian” session box, eliminated the London session box altogether, and shortened the New York session box to highlight the New York open and the London close.


For reference, this image shows the June 22nd, 2016, EURUSD, 15 Minute chart (New York close).

The image above is a zoomed-in version of the first image. If you study this image, you can see that the “Asian” open is easy to find with just the period separator in place. However, the end of the first session box shows us the London open.


Note: The Asian close is not highlighted, but for most traders, this is not important information, because the end of the Asian session overlaps the beginning of the London session. What’s important to most traders is the London open.

Next, you can see the New York open. I’ve shortened the New York session box to highlight the “power hours” when the London and New York sessions overlap. By default, this also shows the close of the London session. The close of the New York session happens at the close of the last candle/bar before the period separator.

As you can see, from the images above, this indicator is great for visually representing the important session opens and closes. That’s why I believe i-Sessions, especially if used that way I showed you in this tutorial, is the best trading session indicator for MetaTrader 4 (MT4).


The image above shows the settings that I use. I’ve edited the indicator to use my settings as the default settings, so if you’re a U.S. trader, or you otherwise use New York close charts, and you’d like your charts to look like mine, you shouldn’t have to change anything. Of course, you can also change the settings to anything that you’d like.


Note: If my default settings don’t automatically work on your charts, you can use a Forex trading session tool, like this one, to adjust the indicator times. You can also use the chart image above as a reference.

Installation Instructions:
  1. Download and extract the custom  i-Sessions indicator.
  2. Place it in your “Indicators” folder (File > Open Data Folder > MQL4 > Indicators).
  3. Restart MT4.
  4. Open your “Navigator” window, if it’s not already open (Ctrl+N).
  5. Drag the i-Sessions indicator onto your chart.
  6. Adjust the settings and colors, if needed, and hit the “OK” button.

There are many trading session indicators available, but most of them leave your charts looking much more cluttered then they need to be. The i-Sessions indicator is simple and clean, especially if you use it like I do, which is why I believe it’s the best trading session indicator for MetaTrader 4 (MT4). What do you think? Is this your favorite trading session indicator? Leave a comment below.

EA Break Even & Manajemen

Perdagangan yang Keren untuk MT4


Gold price action

Gold is known as a safe haven in difficult times. For example, at this time, when the Covid-19 pandemic has made the world economy stumble, many investors have decided to switch to gold.

Investing in physical gold is  indeed a way to protect your assets from inflation. However, did you know a simple gold trading strategy for a relatively short period of time?

This strategy also doesn't require you to always be in front of a PC/laptop. So besides being suitable for beginners, this strategy is also suitable for those of you who have a lot of work.

Let's unlock the secret  of  this easy and simple gold trading !

The secret of the golden movement

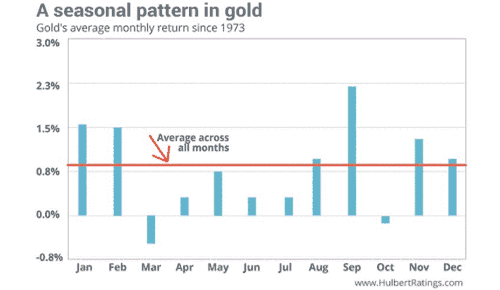
There is a correlation between how gold moves and gold's seasonal pattern. There are certain times of the year when gold is stronger. There are also other times when gold weakens. Although not 100% accurate, the tendency will have the same pattern. Look at the following picture:

Gold Price Cycle

The price of gold, according to seasonal cycles, has a tendency to rise in the first quarter and in the last months. September will be one of the best months to buy gold.

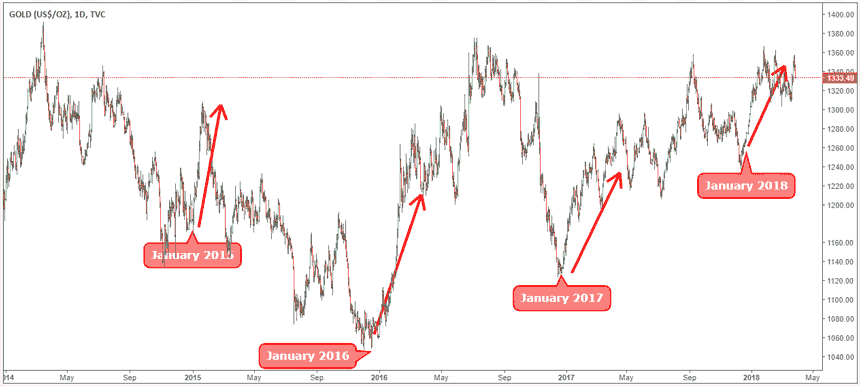
Remember, this is just a general indicator that only gives us an idea of ​​the possible direction of the gold price movement, down or up. The gold chart below is an example of gold price movement.

Gold Price Movement Cycle

Short term gold trading strategy

If your goal of trading gold online is for the medium or long term, then you can take advantage of the seasonal patterns shown above.

For short-term or daily strategies, you can use these strategies:

1. Determine the high, low & close price of gold on the previous day

For this first step, in the morning when the market opens you determine the highest/high price, lowest/low price and closing price/close of the previous day's movement.

2. Using pivot points

The second step you just enter the high, low and close prices earlier into the following formula:

Pivot Point (P) = (High + Low + Close) : 3

Note : Currently, many pivot point calculators will automatically calculate the Pivot Point value as well as support and resistance.

3. Time to start trading gold

The best time to use this strategy is when the London session opens at 14.00 WIB in the summer and at 15.00 WIB in the winter. However, it can be used also at the opening of the New York session with the same success rate.

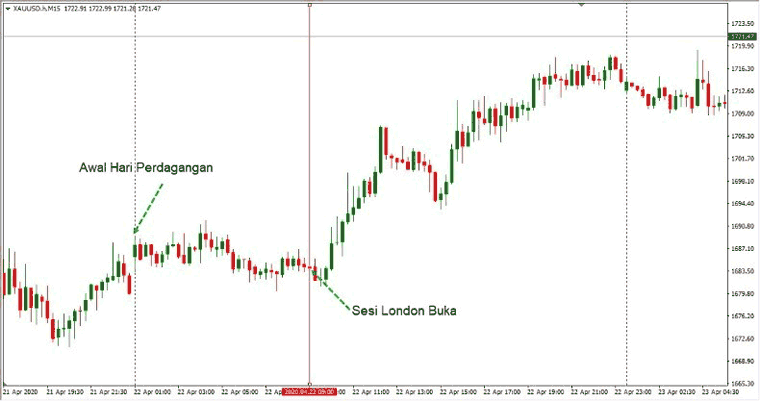
Gold Price Movement Chart When the London Session Opens

4. Strategy to open buy and sell positions

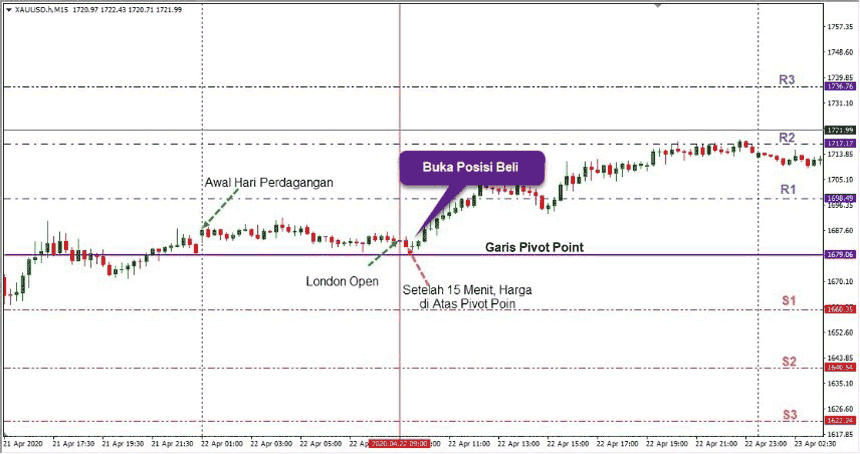
The logic behind this rule is simple, you only need to open a buy position if after the first 15 minutes the price is above the pivot point. On the other hand, open a short position if after the first 15 minutes the price is below the pivot point.

Once the market shows the price is below the pivot point, it is assumed that the downward momentum in the price will continue. If the price is above the pivot point, it is assumed that the upward price momentum will continue.

Pivot Point Gold Trading Strategy (Buy Position)

Important :

If after the first 15 minutes of the London session the price is too close to the first support/resistance level, it is better not to place a position because the profit margin has shrunk.

Don't forget to place a stop loss as a means of protection and place a profit or profit target.

5. Placement of stop-loss

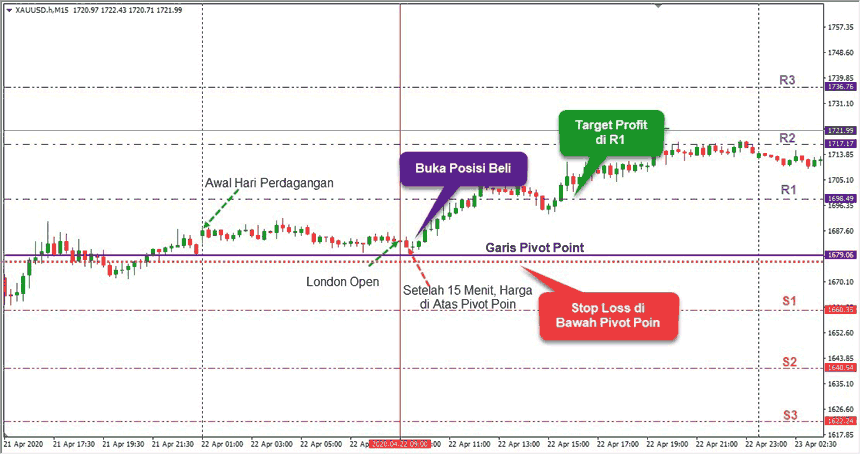
Place a Stop Loss 50-100 pips above the Pivot Point (for Sell positions) and below the Pivot Point (for Buy positions). Take Profit can be placed at Support I (for Sell positions) or at Resistance I (for Buy positions).

Gold Trading Strategy Stop Loss

If you want to try this simple strategy, please  try it on a demo account first  . However, for those of you who are risk-takers and want to immediately be able to benefit from trading gold by using these easy and simple trading methods and strategies, you can immediately

Prediksi dan Kesempurnaan - Dua Musuh dari Trading yang Sukses

Sebagian besar calon pedagang sering menjadi mangsa dua keyakinan irasional - Prediksi dan Kesempurnaan . Gagasan yang salah bahwa untuk men...