Beast Super Signal's MQ4
Stochastic Multi-Timeframe (MTF) Indicator for MT4
Contents [hide]
- What Is Stochastic Oscillator?
- Stochastic Oscillator Formula
- How to Use Stochastic Oscillator?
- Stochastic Oscillator Indicator in MetaTrader
- Stochastic Multi-Timeframe Indicator for MetaTrader
- How to Use Stochastic Multi-Timeframe for MetaTrader?
- Download Stochastic Multi-Timeframe for MetaTrader
- Conclusion
Stochastic oscillator is a very popular indicator among traders. Here you will not only find the explanation of what it is and how to use it, but you will also be able to download Stochastic Multi-Timeframe (MTF) indicator for MetaTrader 4 to help your trading.
What Is Stochastic Oscillator?
Stochastic oscillator is a momentum indicator.
Traders have been using stochastic for over a half a century and even so, it is still very popular.
Being a momentum indicator, stochastic is useful to understand if a trend is exhausting.
Stochastic is the result of the comparison of the price over a specific period of time.
The value of the indicator fluctuates between 0 and 100.
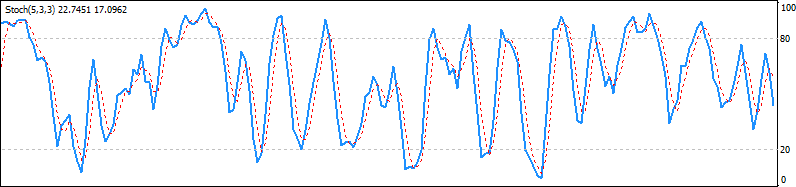
Stochastic indicator's graph includes two lines:
- Main line, which is the value of the indicator calculated with the formula presented below.
- Signal line, which is the moving average of the main line on a specified period; it helps in smoothing the changes.
Stochastic Oscillator Formula
The mathematical formula for the stochastic oscillator is:
%K = ((C - LX) / (HX - LX)) × 100
Where:
- C is the close price.
- LX is the lowest price in the previous X candles.
- HX is the highest price in the previous X candles.
- %K is the stochastic's value of.
How to Use Stochastic Oscillator?
As mentioned earlier, the stochastic value is ranging between 0 and 100. Stochastic includes the main and the signal lines.
When studying this indicator, you usually consider:
- Stochastic above 80 means that the price is overbought, so it will probably retrace or consolidate.
- Stochastic below 20 means that the price is oversold, so it will probably rise or consolidate.
- When the main line crosses the signal line, upwards or downwards, there is probably a change in the trend.
While those are common behavior traits, there are also exceptions with this oscillator.
In fact, not always a line cross would mean that the price will change its direction.
Also, in case of a strong trend, stochastic can remain in an overbought or oversold area for an extended period of time.
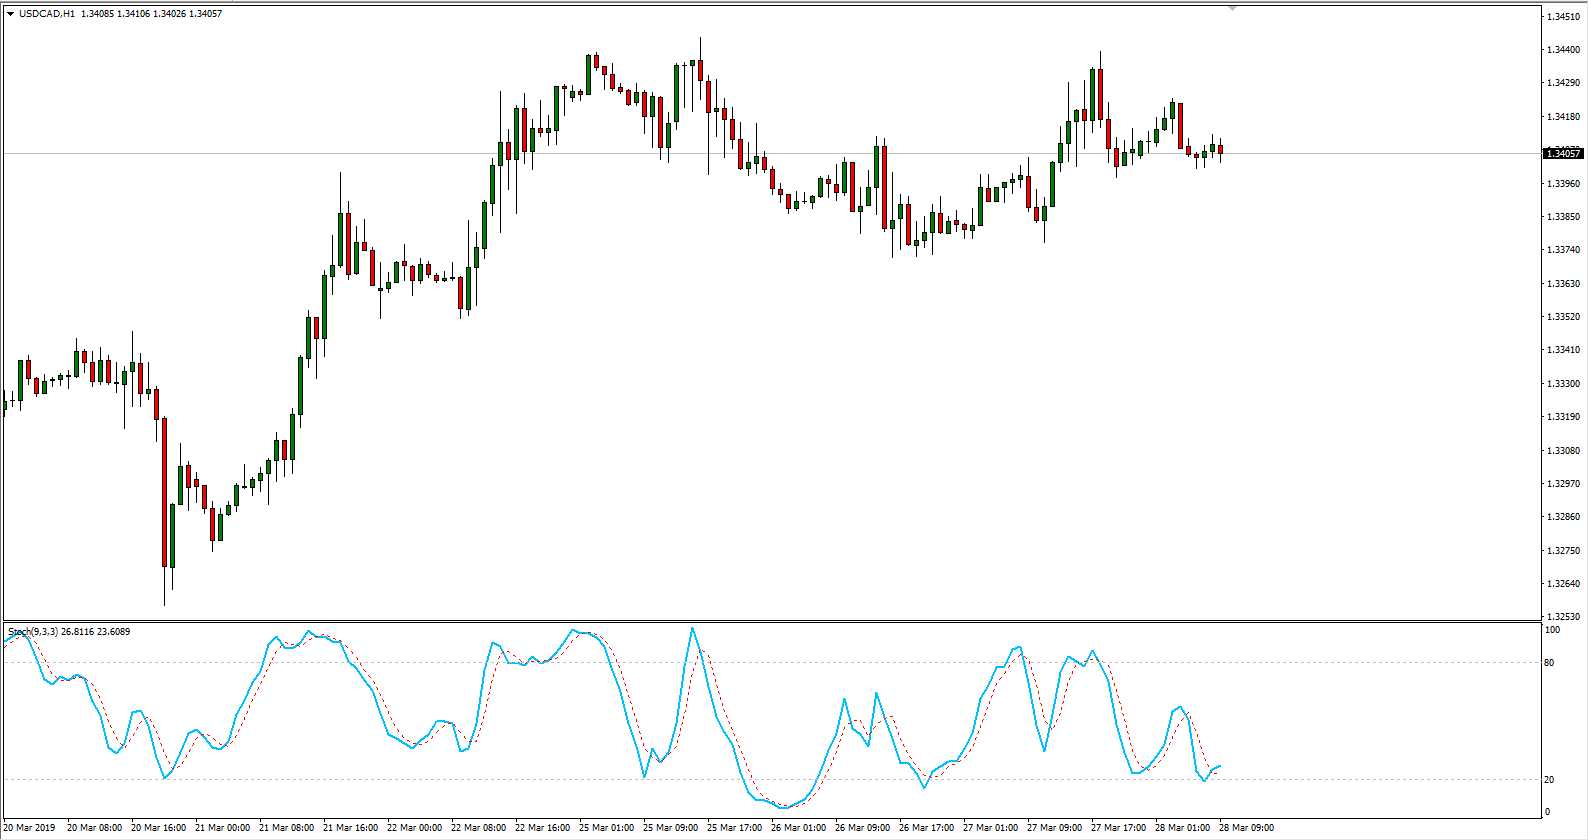
Stochastic Oscillator Indicator in MetaTrader
MetaTrader includes stochastic oscillator as one of the default indicators. It is available in the Oscillators section.
Since there is no alert options, we created an enhanced version of the indicator so that you could receive notifications when the price is oversold or overbought and when there is a cross of the main and signal lines.
Stochastic Multi-Timeframe Indicator for MetaTrader
When you do technical analysis, it is sometimes easy to forget to check the bigger picture.
Often, we focus on a specific chart and timeframe and we don't consider what is happening on a larger scale.
This can also happen when we check stochastic indicator.
We might be checking the value on an M30 chart and it looks oversold. However, checking the indicator on an H4 chart tells us that the pair is perhaps in an overbought area.
Stochastic Multi-Timeframe indicator for MT4 was made to solve this issue specifically.
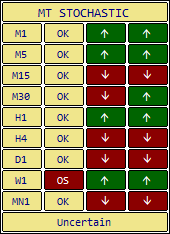
This multi-timeframe (MTF) indicator makes it easy to monitor stochastic oscillator across all the selected timeframes.
You can see the value of the main line and its recent trend for every timeframe in a small table on a single chart.
How to Use Stochastic Multi-Timeframe for MetaTrader?
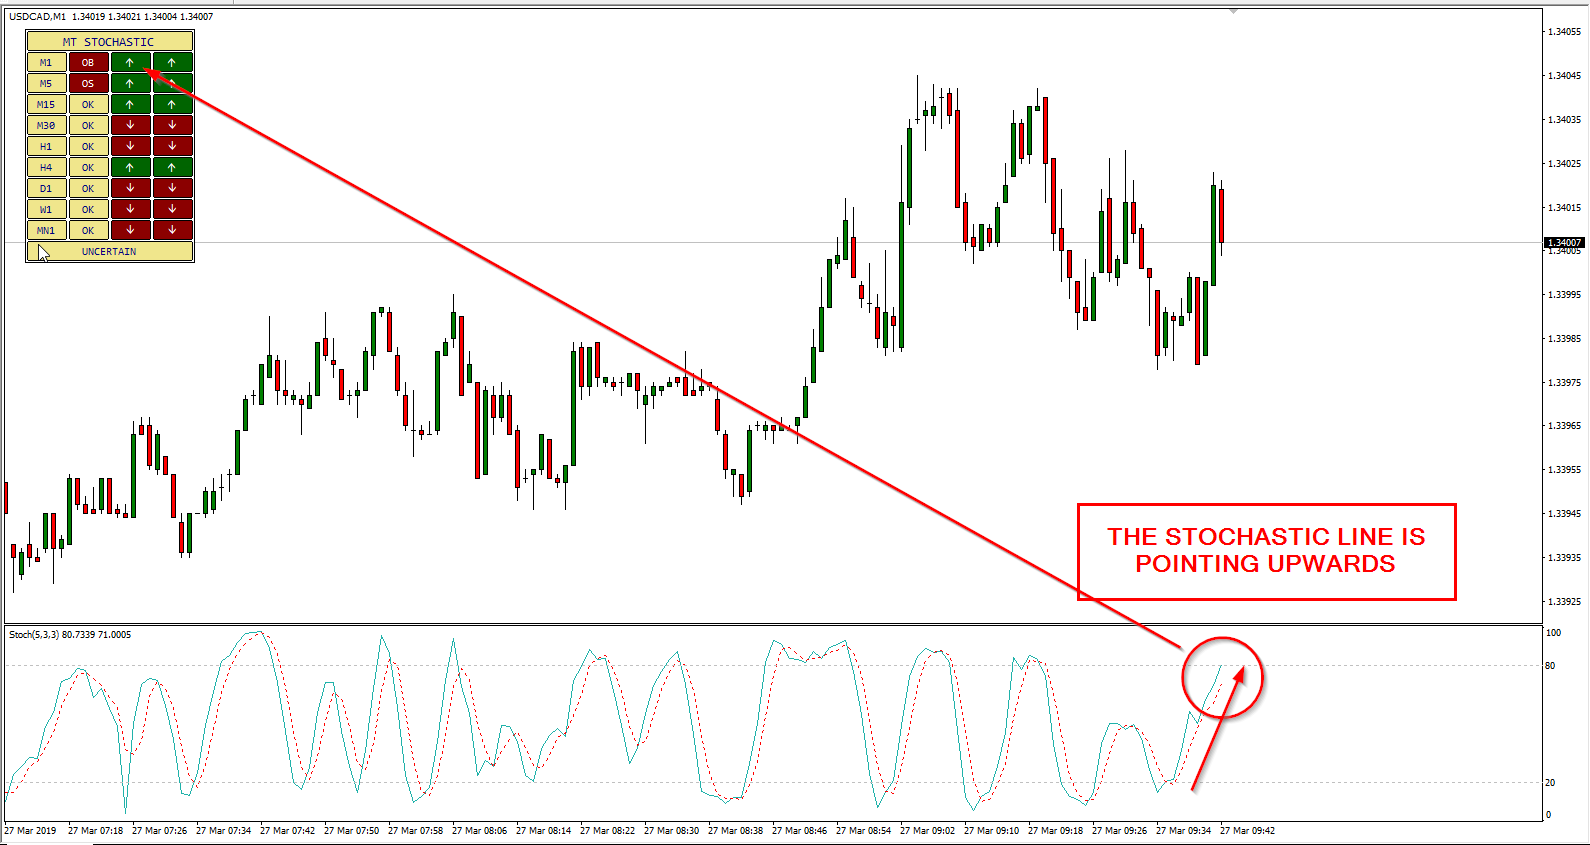
Stochastic Multi-Timeframe indicator for MT4 can show you whether stochastic is currently in an overbought or oversold area for all timeframes.
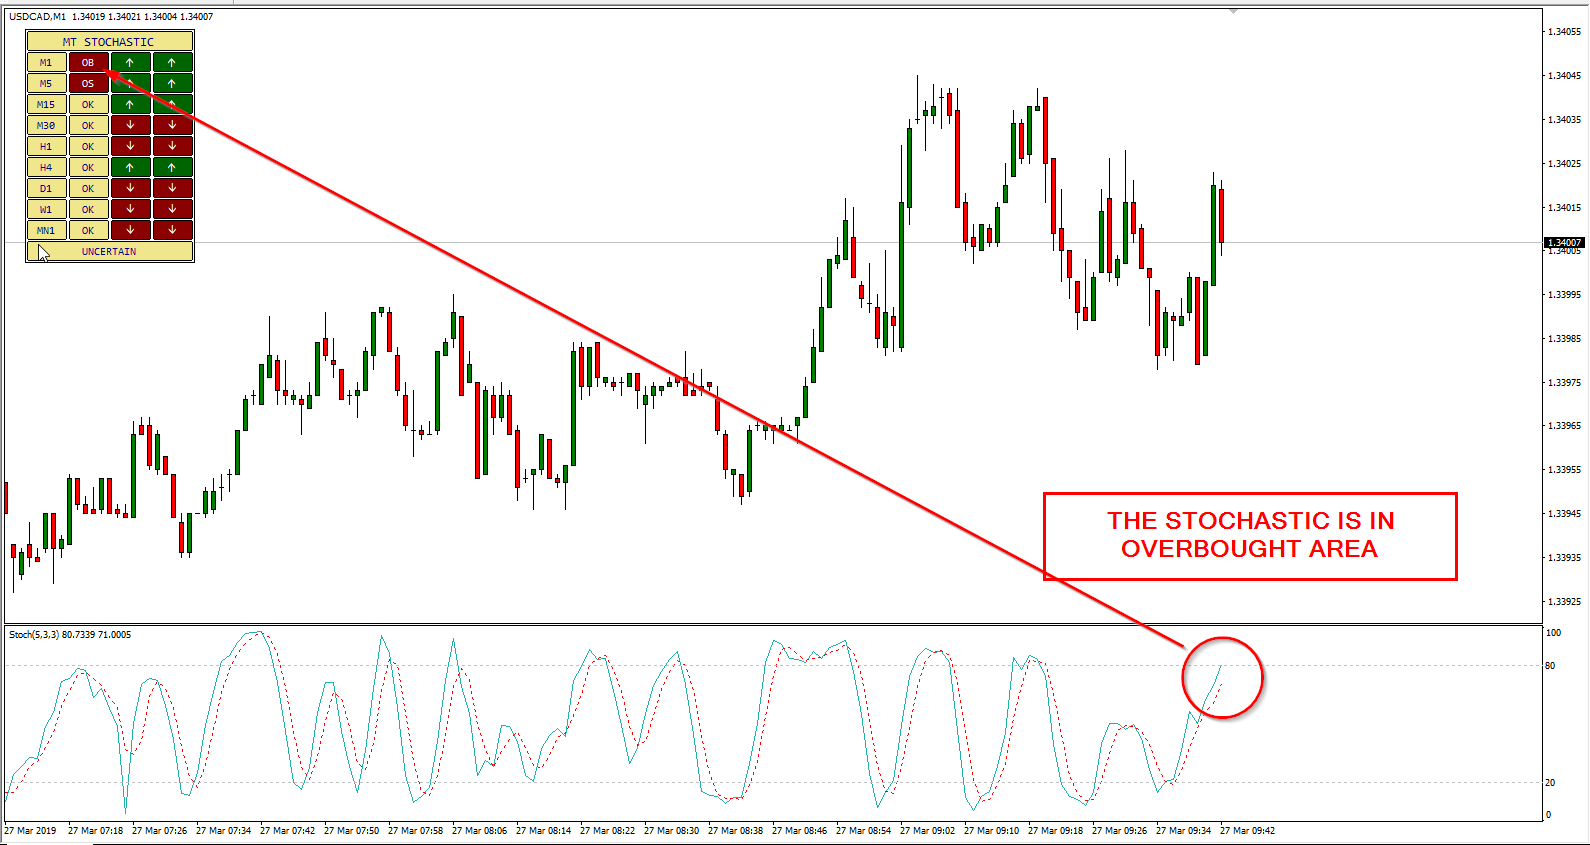
At the same time, the indicator can show you the trend of the main line — whether it is higher or lower than before.
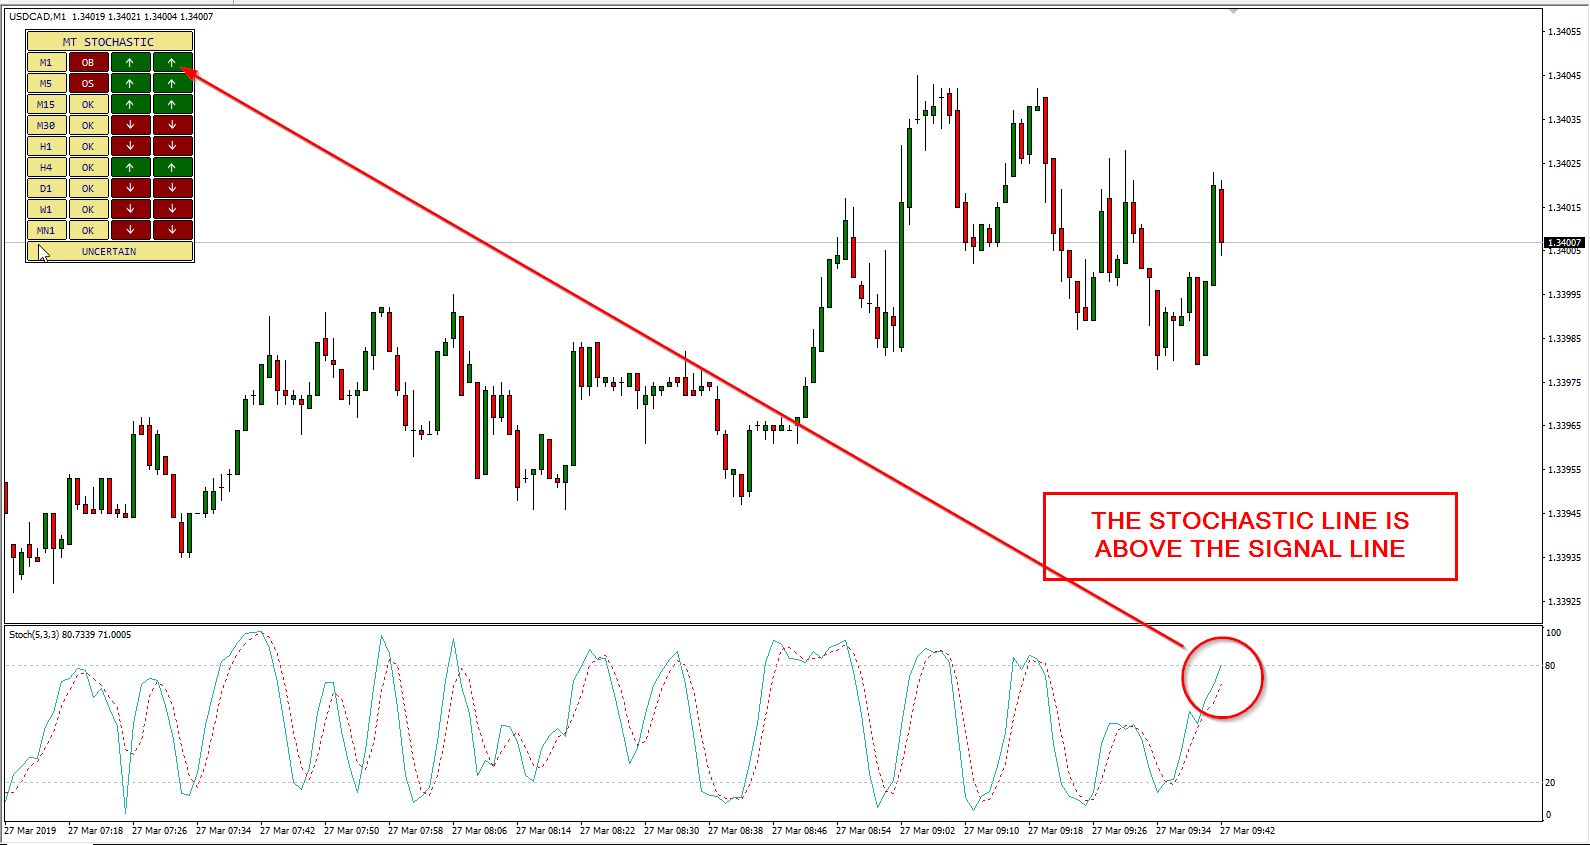
Furthermore, you can also see if the main line crossed the signal line recently.
The indicator includes the following features:
- Alert when all the timeframes are in the same area (overbought/oversold).
- Notification if there is a change in the status, going overbought, oversold, or back to the range.
- Selection of the timeframes — you can decide to include or ignore specific timeframes.
- Notifications to mobile, email, and on screen.
Download Stochastic Multi-Timeframe for MetaTrader
How to Download MT4 Stochastic Multi-Timeframe Indicator?
You can download for free MT4 Stochastic Multi-Timeframe indicator with the link below and install it by following the provided instructions.
The installation is very easy to perform, so is the use.
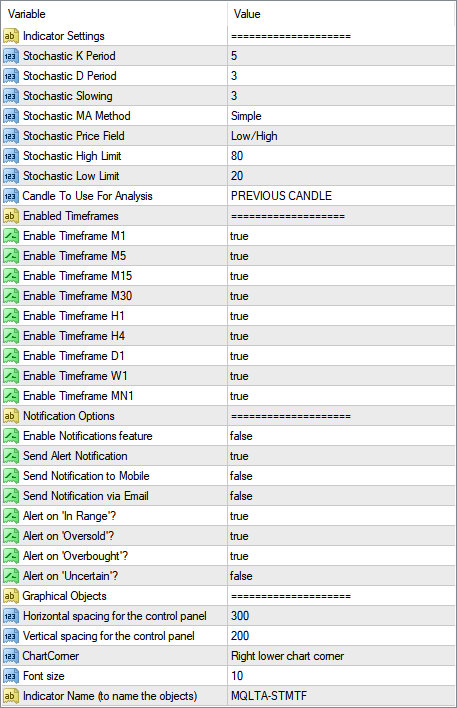
Once you run the indicator, you can set Stochastic parameters, select timeframes, and configure alerts via its input parameters.
➥ Download MQLTA MT4 Stochastic Multi-Timeframe
MT4 Indicator Installation Instructions
To install the MT4 Stochastic Multi-Timeframe indicator, please follow the instructions below:
- Download the indicator archive file.
- Open the MetaTrader 4 data folder (via File→Open Data Folder).
- Open the MQL4 Folder.
- Copy all the folders from the archive directly to the MQL4 folder.
- Restart MetaTrader 4 or refresh the indicators list by right-clicking the Navigator subwindow of the platform and choosing Refresh.
For a more detailed instruction on how to perform the installation and a tutorial video please visit this page.
Conclusion
Even if stochastic oscillator is over 50 years old, it is still worth looking at from time to time. It is a momentum indicator that can help you in spotting overbought and oversold situations and act accordingly.
Stochastic Multi-Timeframe indicator for MT4 allows you to see the status of the oscillator across all timeframes. This way, you can have a better understanding of the overall market situation.
You can open a trading account with any of the MT4 Forex brokers to freely use the indicator for MetaTrader 4 presented here.
If you would like to see other multi-timeframe indicators, you can read our guide on MTF indicators.


